What To Know
- Whether you’re performing a t-test, chi-square test, or ANOVA, the concept of degrees of freedom in statistics plays a crucial role in determining accurate results and valid conclusions.
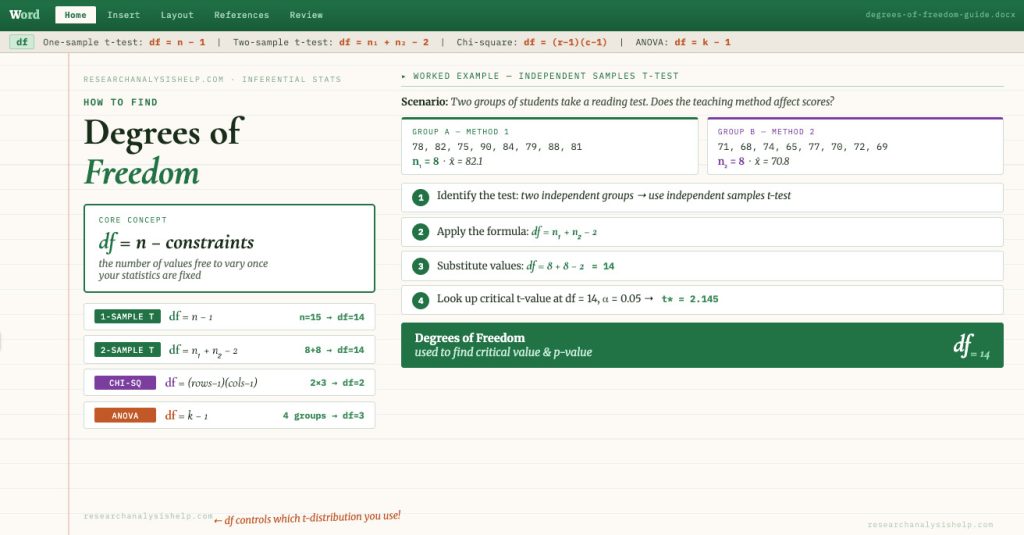
- The degree of freedom (df) refers to the number of values in a dataset that are free to vary when calculating a statistic.
How to Find Degrees of Freedom: A Complete Guide for Researchers
Understanding how to find degrees of freedom is essential for anyone working with statistical analyses. Whether you’re performing a t-test, chi-square test, or ANOVA, the concept of degrees of freedom in statistics plays a crucial role in determining accurate results and valid conclusions.
In this comprehensive guide by ResearchAnalysisHelp.com, we’ll break down the concept of degrees of freedom, explain how to calculate degrees of freedom, and show practical examples across different statistical tests.
Degree of Freedom
The degree of freedom (df) refers to the number of values in a dataset that are free to vary when calculating a statistic.
Definition:
- Degrees of freedom = number of independent pieces of information
- It represents how many values can change without breaking constraints (like a fixed sample mean)
Simple Example:
If you have 5 numbers with a fixed mean:
- Only 4 values are free to vary
- The last value is determined automatically
👉 So, df = 5 − 1 = 4
This idea is central to the concept of degrees of freedom in all statistical tests.
Calculate
To calculate degrees of freedom, you need to understand the relationship between:
- Sample size
- Constraints (like mean or parameters)
General Rule:
[
df = \text{number of values} – \text{number of constraints}
]
This means:
- Take the sample size
- Subtract the number of parameters being estimated
Calculate Degrees of Freedom
Let’s look at how to calculate the degrees of freedom in common situations.
1. For a Sample:
[
df = n – 1
]
- n = sample size
- Subtract 1 because of the sample mean
Example:
If sample size = 10:
[
df = 10 – 1 = 9
]
This reflects 9 independent pieces of information.
Formula
Different tests use different degrees of freedom formulas.
Common Formulas:
- t-test:
[
df = n – 1
] - Two-sample t-test:
[
df = n_1 + n_2 – 2
] - Chi-square test:
[
df = (r – 1)(c – 1)
] - ANOVA:
- Between groups: ( k – 1 )
- Within groups: ( n – k )
These formulas are essential when performing a hypothesis test.
Find Degrees of Freedom
To find degrees of freedom, follow these steps:
- Identify the statistical test
- Determine the sample size
- Count the number of independent pieces
- Apply the correct formula
Key Tip:
Always consider what is being estimated (mean, variance, etc.), because that affects how many values are free to vary.
Chi-Square
In chi-square (χ²) tests, degrees of freedom depend on categories.
Formula:
[
df = (r – 1)(c – 1)
]
Where:
- r = rows
- c = columns
Example:
If a table has 3 rows and 4 columns:
[
df = (3 – 1)(4 – 1) = 2 \times 3 = 6
]
Statistic
Degrees of freedom directly affect the statistic you calculate.
- Used to determine the critical value
- Helps interpret probability distribution
- Influences whether results are statistically significant
Chi-Square Test
In a chi-square test, df determines how the chi squared distribution behaves.
Why It Matters:
- Different df values → different shapes of the distribution
- Affects decision to reject the null hypothesis
Hypothesis Test
In any hypothesis test, degrees of freedom help:
- Define the sampling distribution
- Identify the correct critical value
- Improve accuracy of conclusions
Degrees of Freedom Calculator
A degrees of freedom calculator can simplify the process.
Tools:
- SPSS
- Excel
- Online calculators
Benefit:
- Quickly compute df without manual calculation
- Useful for complex statistical analyses
Degrees of Freedom in Statistics
The degrees of freedom in statistics represent the flexibility in your data.
Key Insight:
- More df → more reliable estimates
- Less df → higher uncertainty
Find the Degrees of Freedom
To find the degrees of freedom, always ask:
- How many values are there?
- How many constraints exist?
Then apply:
[
df = n – \text{constraints}
]
df
The abbreviation df is used in all statistical outputs.
Example:
- t(9) = 2.45 → df = 9
It indicates the number of degrees of freedom used in the test.
Statistical
In statistical work, df is critical for:
- Calculating variance
- Estimating standard error
- Performing statistical tests
T-Test
In a t-test, df determines the shape of the t distribution.
Example:
[
df = n – 1
]
For two groups:
[
df = n_1 + n_2 – 2
]
Linear Regression
In linear regression, degrees of freedom are:
[
df = n – p
]
Where:
- n = sample size
- p = number of parameters
Why It Matters:
- Affects model accuracy
- Influences variance estimation
Degrees of Freedom Formula
The degrees of freedom formula depends on the test, but the general idea is:
[
df = \text{number of observations} – \text{number of estimated parameters}
]
Probability Distribution
Degrees of freedom define the shape of a probability distribution.
Examples:
- t-distribution
- Chi-square distribution
Higher df → distribution approaches normal distribution
Use the Degrees of Freedom
You use the degrees of freedom to:
- Find critical values
- Interpret test statistics
- Decide whether to reject the null hypothesis
Putting It All Together
Example Scenario:
You conduct a t-test with:
- Sample size = 15
[
df = 15 – 1 = 14
]
Then:
- Compare your test statistic with the critical value using df = 14
- Determine significance
Get Expert Help with Degrees of Freedom & Statistical Analysis
Still unsure how to find degrees of freedom, apply the right formula, or interpret results in your assignments?
Here are relevant assignments you can use for coursework, practice, or academic projects related to how to find degrees of freedom:
1. Basic Degrees of Freedom Calculation Assignment
Task:
Explain the concept of degrees of freedom and manually calculate degrees of freedom for different datasets.
Requirements:
- Define:
- Degree of freedom (df)
- Number of independent pieces of information
- Use the formula:
- ( df = n – 1 )
- Provide examples using sample data
Goal:
Understand how values are free to vary and how constraints affect df.
2. Degrees of Freedom in t-Test Assignment
Task:
Calculate and interpret degrees of freedom in a t-test.
Steps:
- Use:
- ( df = n – 1 ) (one-sample)
- ( df = n_1 + n_2 – 2 ) (two-sample)
- Perform a hypothesis test
- Compare test statistic with critical value
Focus:
- Role of df in determining significance
- Impact on probability distribution
3. Chi-Square Test and Degrees of Freedom Assignment
Task:
Apply chi-square (χ²) analysis and compute df.
Requirements:
- Use formula:
[
df = (r – 1)(c – 1)
] - Perform a chi-square test
- Interpret results relative to the null hypothesis
Goal:
Understand how df affects the chi squared distribution.
4. ANOVA and Degrees of Freedom Assignment
Task:
Perform analysis of variance (ANOVA) and calculate degrees of freedom.
Include:
- Between-group df: ( k – 1 )
- Within-group df: ( n – k )
- Use sum of squares
Focus:
- Relationship between sample size, variance, and df
- Interpretation in statistical analyses
5. Regression Analysis Assignment (Degrees of Freedom)
Task:
Compute degrees of freedom in linear regression.
Formula:
[
df = n – p
]
Where:
- n = sample size
- p = number of parameters
Focus:
- How df affects model accuracy
- Role in estimating variance
6. Degrees of Freedom and Variance Assignment
Task:
Explore how df is used in calculating variance and standard deviation.
Steps:
- Use:
[
s^2 = \frac{\sum (x – \bar{x})^2}{n-1}
] - Explain why n-1 is used instead of n
Goal:
Understand unbiased estimation and independent pieces of information.
7. Hypothesis Testing with Degrees of Freedom Assignment
Task:
Conduct a full hypothesis test using df.
Include:
- Define:
- Null hypothesis
- Calculate:
- Test statistic
- Degrees of freedom
- Compare with critical value
8. Probability Distribution and Degrees of Freedom Assignment
Task:
Analyze how degrees of freedom affect probability distributions.
Focus:
- Compare:
- t-distribution vs normal distribution
- Explain how increasing df changes distribution shape
9. Degrees of Freedom Calculator Assignment
Task:
Use a degrees of freedom calculator (SPSS/Excel/manual) to verify results.
Steps:
- Input sample datasets
- Compute df for:
- t-test
- ANOVA
- Chi-square
Goal:
Validate manual calculations using tools.
10. Comparative Assignment: Different Statistical Tests
Task:
Compare how degrees of freedom are calculated across:
- t-test
- chi-square test
- ANOVA
- linear regression
Focus:
- Differences in formulas
- Impact on statistical testing
Final Tip
These assignments will help you:
- Master the degrees of freedom formula
- Understand its role in statistical tests
- Improve accuracy in hypothesis testing and analysis
Final Thoughts
Understanding how to find degrees of freedom is essential for accurate statistical analyses.
Key Takeaways:
- df = number of independent pieces of information
- Usually calculated as sample size minus constraints
- Used in:
- t-test
- chi-square test
- ANOVA
- linear regression
Why It Matters:
Degrees of freedom influence:
- Variance estimates
- Probability distributions
- Hypothesis testing outcomes
Mastering this concept helps you perform more accurate and reliable research.
Need Help with Statistical Calculations?
At ResearchAnalysisHelp.com, we provide:
- ✔️ Step-by-step help to calculate the degrees of freedom
- ✔️ Support with SPSS, ANOVA, t-tests, and chi-square tests
- ✔️ Expert guidance for all statistical analyses
👉 Visit ResearchAnalysisHelp.com today and simplify your statistics journey!
Here are clear, expert-crafted FAQ answers—blending concise bullet points with explanatory prose—positioned to highlight the expertise of ResearchAnalysisHelp.com:
FAQs
What is the formula for degrees of freedom?
The degrees of freedom formula depends on the type of statistical test, but the core idea remains consistent.
General Formula:
- Degrees of freedom equals:
👉 sample size minus the number of parameters estimated
Common Examples:
- One-sample t-test:
- ( df = n – 1 )
- This means sample size minus the number of constraints (the sample mean)
- 2-sample t-test:
- ( df = n_1 + n_2 – 2 )
- Here, we subtract two parameters to estimate
- Chi square test:
- ( df = (r – 1)(c – 1) )
- Where r rows and c columns define categories
- One-way ANOVA:
- Between groups: ( k – 1 )
- Degrees of freedom within groups: ( n – k ) (also called error degrees of freedom)
Key Insight:
Degrees of freedom are used to calculate test statistics and determine critical values. At ResearchAnalysisHelp.com, we ensure you apply the correct formula for degrees of freedom for various statistical tests.
How do we determine the degrees of freedom?
To determine degrees of freedom, you need to identify how many values are free to change in your dataset.
Steps:
- Start with the sample size
- Subtract the number of constraints (minus the number of parameters)
- The result gives the number of independent values
Explanation:
- Degrees of freedom refers to the freedom to vary in your data
- It represents how many pieces of information available can change independently
Example:
- If you have 5 values with a fixed mean:
- Only 4 values can vary → 1 degrees of freedom is lost
- So, df = 4
Key Point:
- Degrees of freedom are always tied to the number of constraints in your analysis
- They are closely related to sample size
At ResearchAnalysisHelp.com, we simplify this process so you gain a clear understanding about degrees of freedom in any scenario.
How do I find the DF?
Finding DF (degrees of freedom) depends on the type of statistical test you are using.
Quick Guide:
- t-test → ( df = n – 1 )
- 2-sample t-test → ( df = n_1 + n_2 – 2 )
- Chi square test → ( (r – 1)(c – 1) )
- ANOVA → depends on groups and total observations
Important Notes:
- Degrees of freedom are used in inferential statistics to:
- Determine critical values
- Interpret test results
- A calculator finds df easily, but understanding the logic is essential
Example:
- If you have two values in a dataset:
- Only one degree of freedom exists
How to find how many degrees of freedom you have?
To find how many degrees of freedom you have, think in terms of independent pieces of information.
Key Idea:
- Freedom are the number of values that can vary freely
- Degrees of freedom also reflect how much information is available after constraints
Practical Approach:
- Identify your sample size
- Determine constraints (e.g., mean, parameters)
- Apply:
👉 df = sample size minus the number of constraints
Examples:
- 1 degrees of freedom → very limited variability
- 2 degrees of freedom → slightly more flexibility
- three degrees of freedom → more reliable estimates
- many degrees of freedom → higher accuracy and stability
Why It Matters:
- Higher degrees of freedom improve reliability
- When sample size is small, df is limited, reducing accuracy
Applications:
- Used in:
- Hypothesis testing
- Descriptive statistics
- Chi-square distribution (you use the chi-square distribution based on df)
Final Insight:
Degrees of freedom are important because they directly impact:
- Statistical accuracy
- Reliability of results
- Validity of conclusions
At ResearchAnalysisHelp.com, we help you correctly compute and use degrees of freedom across all types of statistical tests, ensuring your analysis is precise and academically sound.
Need Expert Help?
Confused about degrees of freedom, formulas, or statistical tests?
At ResearchAnalysisHelp.com, we offer:
- ✔️ Step-by-step statistical guidance
- ✔️ Help with assignments and research
- ✔️ Tools like sample size calculator and SPSS support
👉 Get expert help today and master statistics with confidence!