What To Know
- Whether you’re analyzing the outcome of rolling a dice, tossing a coin, or dealing with more complex probability distributions, learning how to calculate probability is a crucial skill in data analysis.
- The z-score is used to calculate the probability of a data point falling within a certain range of the normal distribution.
How to Find Probability: A Comprehensive Guide
In statistics, probability is a measure of the likelihood of a specific event occurring. Whether you’re analyzing the outcome of rolling a dice, tossing a coin, or dealing with more complex probability distributions, learning how to calculate probability is a crucial skill in data analysis. In this comprehensive guide, we’ll explore how to find probability, with examples and practical tips to help you grasp the concept and apply it to real-world scenarios.
What is Probability?
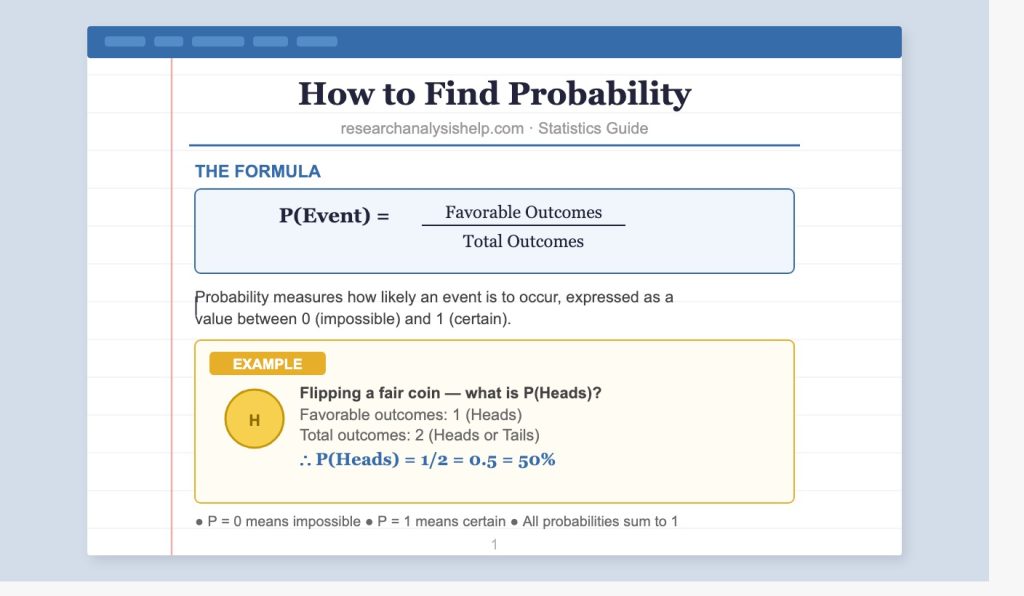
Probability refers to the chance or likelihood that a particular event will occur. It is always a value between 0 and 1, where:
- 0 means the event will never happen.
- 1 means the event will certainly happen.
In mathematical terms, the probability of an event occurring is defined as:
[
P(A) = \frac{\text{Number of favorable outcomes}}{\text{Total number of possible outcomes}}
]
Where:
- ( P(A) ) represents the probability of event A occurring.
- The total number of possible outcomes refers to all the possible results that can occur during an experiment.
Types of Probability Events
- Independent Events:
- Two events are independent if the occurrence of one event does not affect the occurrence of the other.
- Example: Tossing a coin. The outcome of the first toss (heads or tails) does not affect the outcome of the second toss.
- Dependent Events:
- Two events are dependent if the occurrence of one event affects the probability of the other event.
- Example: Drawing two cards from a deck without replacement. The probability of the second card being a king is dependent on whether the first card drawn was a king or not.
- Mutually Exclusive Events:
- Two events are mutually exclusive if they cannot occur at the same time.
- Example: Rolling a dice and getting a 6. You cannot roll a 3 and a 6 on the same roll.
How to Calculate Probability: Step-by-Step Process
Step 1: Identify the Event and Total Outcomes
Start by identifying the event whose probability you are trying to calculate and the total number of possible outcomes. For example, if you’re rolling a six-sided dice, the possible outcomes are 1, 2, 3, 4, 5, 6.
Step 2: Count the Number of Favorable Outcomes
Next, determine how many of the possible outcomes are favorable for your event. For example, if you’re interested in the probability of rolling an even number, the favorable outcomes are 2, 4, 6.
Step 3: Apply the Probability Formula
Use the formula:
[
P(\text{Event}) = \frac{\text{Number of favorable outcomes}}{\text{Total number of possible outcomes}}
]
For the even number example:
[
P(\text{Even number}) = \frac{3}{6} = 0.5
]
So, the probability of rolling an even number on a six-sided dice is 0.5 (or 50%).
Example: Finding Probability with a Coin Toss
Let’s look at a simple example: tossing a coin. The two possible outcomes are heads and tails.
- The total number of possible outcomes is 2 (heads and tails).
- If you’re interested in the probability of getting heads, there is 1 favorable outcome (heads).
The probability of getting heads is:
[
P(\text{Heads}) = \frac{1}{2} = 0.5
]
Thus, there is a 50% chance of landing heads on a single coin toss.
Standard Normal Distribution and Z-Scores
When dealing with continuous random variables, probability often involves the standard normal distribution, also known as the bell curve. This curve represents the distribution of many natural phenomena (e.g., test scores, heights, etc.) and is symmetrical around the mean.
In a standard normal distribution, the mean is 0, and the standard deviation is 1. The z-score is used to calculate the probability of a data point falling within a certain range of the normal distribution.
The z-score formula is:
[
z = \frac{x – \mu}{\sigma}
]
Where:
- ( x ) = the data point
- ( \mu ) = the mean
- ( \sigma ) = the standard deviation
Once the z-score is calculated, you can use the z-table to find the probability of that z-score occurring within the normal distribution.
Video Explanation of Probability: Khan Academy & YouTube
For further understanding, there are excellent video resources like Khan Academy and YouTube that break down the concept of probability with clear explanations and examples. These videos can help you visualize how probabilities are calculated in various scenarios, such as tossing coins, rolling dice, or working with normal distributions.
Probability in Real-World Scenarios
Understanding probability has real-world applications across various fields:
- Risk Assessment:
- Companies use probability to assess the likelihood of certain outcomes, such as product failures or market shifts.
- Medical Testing:
- In medical research, probability helps in determining the likelihood of disease occurrence or response to treatment.
- Sports Analytics:
- Probability is used to predict the outcome of games, analyze player performance, and assess team success.
Common Challenges in Probability Calculations
Understanding the Likelihood of an Event
One of the key aspects of probability is understanding how likely or unlikely an event is to occur. For example, the probability of drawing a red card from a deck of 52 cards is:
[
P(\text{Red Card}) = \frac{26}{52} = 0.5
]
Here, 26 is the number of red cards (hearts and diamonds), and 52 is the total number of cards in the deck.
The Probability of “At Least One” Event
Often, you may be asked to calculate the probability of at least one event happening. For example, the probability of at least one head in two coin tosses. This can be calculated as:
[
P(\text{At least one head}) = 1 – P(\text{No heads})
]
The probability of no heads (both tails) is:
[
P(\text{No heads}) = \frac{1}{4} \quad \text{(tail, tail)}
]
So, the probability of at least one head is:
[
P(\text{At least one head}) = 1 – \frac{1}{4} = \frac{3}{4}
]
Thus, there’s a 75% chance of getting at least one head in two coin tosses.
Need help with probability and statistical analysis?
Whether you’re calculating z-scores, analyzing normal distributions, or interpreting p-values, Research Analysis Help is here to support you at every step.
Related Assignments to Master Probability and Statistical Analysis
These assignments are designed to deepen your understanding of probability and statistical analysis, focusing on how to calculate probabilities and interpret statistical data effectively. Whether you’re analyzing independent events or working with a normal distribution, these assignments will help you develop the skills you need to solve various statistical problems.
1. Calculating the Probability of Independent Events
Assignment: Given two independent events, calculate the probability of both events occurring. Use the multiplication rule for independent events and apply it to real-world examples, such as rolling two dice or drawing two cards.
- Goal: Learn how to calculate probabilities for independent events.
- Tools: Probability formula, statistical software.
- Key Terms: Independent, operation, sum, choice.
2. Finding Probability Using the Standard Normal Distribution
Assignment: Use the standard normal distribution to find the probability of a given z-score. Calculate the p-value for a 95% confidence interval and interpret the results using a z-table.
- Goal: Master the use of the standard normal distribution and z-scores to calculate probabilities.
- Tools: Z-table, statistical software.
- Key Terms: Standard normal, 95, subtract, approximate.
3. Solving Probability Problems with Mutually Exclusive Events
Assignment: Given two mutually exclusive events, calculate the probability of either event occurring. Use the addition rule for mutually exclusive events and interpret the results in practical scenarios, such as drawing cards from a deck.
- Goal: Understand how to calculate probability for mutually exclusive events.
- Tools: Addition rule, probability calculator.
- Key Terms: Equal, fail, general case, solve.
4. Probability of Multiple Independent Choices
Assignment: If you have multiple independent choices, calculate the overall probability of making a specific choice. For example, calculate the probability of flipping heads on three consecutive coin tosses.
- Goal: Calculate the probability of multiple independent events occurring together.
- Tools: Multiplication rule, probability distribution.
- Key Terms: Independent, choice, certainty.
5. Understanding the Relationship Between Probability and Confidence
Assignment: Calculate the confidence interval for a sample mean and interpret the 95% confidence level. Discuss how confidence intervals represent the range of values where the true population parameter is likely to fall.
- Goal: Understand how probability and confidence intervals are related in hypothesis testing.
- Tools: Confidence interval formula, z-score.
- Key Terms: 95, characteristic, choice, general case.
6. Using Z-Scores for Confidence Intervals
Assignment: Calculate the z-score for a given sample and use it to determine the confidence interval for the population mean. Analyze how the confidence interval helps estimate the true parameter and interpret the results.
- Goal: Calculate z-scores and use them to compute confidence intervals.
- Tools: Z-table, confidence interval formula.
- Key Terms: Standard normal, confidence level, subtract, choice.
7. Finding the Probability of an Event Based on the Standard Normal Curve
Assignment: Given a normal distribution curve, calculate the probability that a value falls within a specific range using the standard normal distribution. Apply the results to real-world data, such as test scores or exam results.
- Goal: Use the standard normal curve to calculate probabilities for continuous data.
- Tools: Z-table, statistical software.
- Key Terms: Normal distribution curve, operation, sum, solve.
8. Comparing Probabilities in Real-World Scenarios
Assignment: In a real-world scenario, compare the probabilities of two events and explain which is more likely to occur. For example, calculate the probability of drawing a red card from a deck of cards and the probability of rolling a 6 on a dice.
- Goal: Understand and compare probabilities in various real-world situations.
- Tools: Probability formula, statistical analysis tools.
- Key Terms: Choice, sum, event, solve.
9. Evaluating Probabilities with Multiple Outcomes
Assignment: Given a situation with multiple possible outcomes, calculate the probability of a specific event. For example, calculate the probability of rolling an odd number on a 12-sided dice.
- Goal: Calculate the probability of an event with multiple possible outcomes.
- Tools: Probability distribution, dice roll example.
- Key Terms: Odd, even, choice, probability.
10. Calculating the Likelihood of an Event Using a Venn Diagram
Assignment: Use a Venn diagram to represent two overlapping events and calculate the probability of either event occurring. Interpret the results and explain how to calculate the probability of the union of events.
- Goal: Visualize and calculate the probability of events using Venn diagrams.
- Tools: Venn diagram, probability formula.
- Key Terms: Subtract, union of events, solve, choice.
These related assignments will help you strengthen your understanding of probability calculations, from basic coin tosses to more complex probability distributions. By practicing these exercises, you will learn how to calculate probabilities, interpret results, and apply statistical concepts to real-world scenarios.
For expert help with probability or any other statistical analysis, Research Analysis Help is here to assist you every step of the way!
📧 Contact us today at Research Analysis Help for personalized guidance on probability calculations and statistical analysis! 📊
Conclusion
Probability is a fascinating and useful concept in statistics that helps us quantify the likelihood of events. By calculating probability, you can better understand how to predict outcomes and make informed decisions based on available data.
At Research Analysis Help, we provide expert assistance in probability calculations, from simple dice rolls to complex statistical distributions. If you need help with probability problems or want to learn more about advanced statistical techniques, reach out to us today!
📧 Contact us now at Research Analysis Help for expert guidance on probability and statistical analysis! 📊
Additional Notes
- 0 and 1: The probability of an event always falls between 0 and 1, where 0 means the event will not happen and 1 means it will happen.
- Variance: When calculating probability, the variance of the data may affect the distribution of outcomes, especially in continuous random variables like those in a normal distribution curve.
- Use of Venn Diagrams: A Venn diagram can be helpful for visualizing and calculating the probability of overlapping events.
Final Thoughts
Calculating probability is a key part of statistical analysis and can help you understand the likelihood of various events occurring in random experiments. Whether you’re using a normal distribution curve, calculating p-values, or just performing basic probability calculations like rolling a dice or tossing a coin, knowing how to calculate probability is a crucial skill.
At Research Analysis Help, we offer expert assistance with probability calculations, statistical analysis, and hypothesis testing. If you need help with probability exercises or have questions about statistical concepts, contact us today!
📧 Get in touch now at Research Analysis Help for personalized support with your statistical analysis! 📊
Key Terms Explained
- Event: An outcome or a set of outcomes that you are interested in measuring.
- Sample Space: The total number of possible outcomes in a given experiment.
- Probability Distribution: A mathematical function that gives the probability of different outcomes in a random experiment.
- Independent Events: Events where the outcome of one does not affect the outcome of another (e.g., tossing a coin twice).
- Mutually Exclusive Events: Events that cannot happen at the same time (e.g., rolling a 2 and a 5 on a single dice roll).
Real-World Example: Rolling a Dice
Let’s calculate the probability of rolling an even number on a fair six-sided dice:
- The event is rolling an even number (2, 4, or 6).
- The favorable outcomes are 2, 4, and 6, so there are 3 favorable outcomes.
- The total number of possible outcomes is 6 (the six faces of the dice).
- Using the formula:
[
P(\text{Even number}) = \frac{3}{6} = 0.5
]
Thus, the probability of rolling an even number is 50%.
FAQs:
How Do We Calculate a Probability?
To calculate probability, we follow these key steps:
- Identify the Event:
- Start by defining the event you want to calculate the probability for. For example, the event might be “rolling a 6 on a dice” or “getting an even number on a coin toss.”
- Determine Total Outcomes:
- Determine the total number of possible outcomes for the experiment. For example, when rolling a fair six-sided dice, the total number of possible outcomes is 6 (1, 2, 3, 4, 5, 6).
- Find the Favorable Outcomes:
- Count how many of the outcomes are favorable to your event. For example, if you want to know the probability of rolling an odd number, the favorable outcomes are 1, 3, and 5, so there are 3 favorable outcomes.
- Apply the Formula:
The basic formula for probability is: [
P(A) = \frac{\text{Number of favorable outcomes}}{\text{Total number of possible outcomes}}
]- Using the example of rolling an odd number on a dice:
[
P(\text{Odd number}) = \frac{3}{6} = 0.5
]
- Using the example of rolling an odd number on a dice:
How Do You Find Out the Probability?
To find the probability of an event, follow these steps:
- Define the Event:
- Clearly identify what event you want to measure the probability for. For example, you might want to know the probability of drawing a red card from a deck of playing cards.
- Count the Outcomes:
- Identify the total number of possible outcomes (e.g., a deck of cards has 52 cards).
- Identify the favorable outcomes (e.g., there are 26 red cards: 13 hearts and 13 diamonds).
- Use the Formula:
[
P(\text{Event}) = \frac{\text{Number of favorable outcomes}}{\text{Total number of possible outcomes}}
] In the example of drawing a red card:
[
P(\text{Red card}) = \frac{26}{52} = 0.5
]
So, the probability of drawing a red card is 50%.
What is the Basic Formula for Probability?
The basic formula for probability is:
[
P(A) = \frac{\text{Number of favorable outcomes}}{\text{Total number of possible outcomes}}
]
Where:
- ( P(A) ) is the probability of event A occurring.
- The favorable outcomes are the number of outcomes that match the event you’re interested in.
- The total number of possible outcomes is the total number of results the experiment can produce.
For example, if you want to find the probability of drawing an even number from a set of numbers from 1 to 6, the favorable outcomes are 2, 4, and 6. There are 3 favorable outcomes out of 6 total outcomes:
[
P(\text{Even number}) = \frac{3}{6} = 0.5
]
This formula can be applied to dice rolls, coin tosses, and other random experiments.
What is the Formula for Probability of A?
The formula for the probability of event A is the same as the basic formula for probability:
[
P(A) = \frac{\text{Number of favorable outcomes}}{\text{Total number of possible outcomes}}
]
To illustrate:
- If A represents the event of drawing a tail from a fair coin (with heads and tails as outcomes), the probability of A (tail) is:
[
P(A) = \frac{1}{2} = 0.5
]
This means the probability of drawing a tail is 50%.
For more complex events, you can use tables, Venn diagrams, or probability distributions to calculate the probabilities. These methods help in cases of mutually exclusive events, independent events, and in calculating variance or probabilities from the normal distribution curve.