What To Know
- A confidence interval provides a range of plausible values for a population parameter, such as the mean or proportion, based on sample data.
- It is derived from the sample mean and standard deviation and is accompanied by a confidence level that quantifies the degree of certainty that the interval contains the true value of the parameter.
How to Calculate a Confidence Interval: A Comprehensive Guide
In statistical analysis, the confidence interval (CI) is one of the most important tools for estimating the range of values that likely contain the true population parameter (e.g., population mean). By calculating a confidence interval, you can infer the possible values for an unknown statistical parameter based on a random sample.
This blog post will explore how to calculate confidence intervals, understand the factors that affect their width, and practice interpreting the results in a real-world context.
What is a Confidence Interval?
A confidence interval provides a range of plausible values for a population parameter, such as the mean or proportion, based on sample data. It is derived from the sample mean and standard deviation and is accompanied by a confidence level that quantifies the degree of certainty that the interval contains the true value of the parameter.
For example, if you calculate a 95% confidence interval for the population mean, you can be 95% confident that the interval contains the true population mean.
Key Components of a Confidence Interval:
- Point Estimate: The sample statistic (e.g., sample mean) that serves as the best estimate of the population parameter.
- Confidence Level: The probability that the confidence interval contains the true population parameter (e.g., 95%, 99%).
- Margin of Error: The amount added and subtracted from the point estimate to form the interval, indicating the uncertainty in the estimate.
Types of Confidence Intervals
There are different types of confidence intervals depending on the data and the parameter being estimated. The most common are:
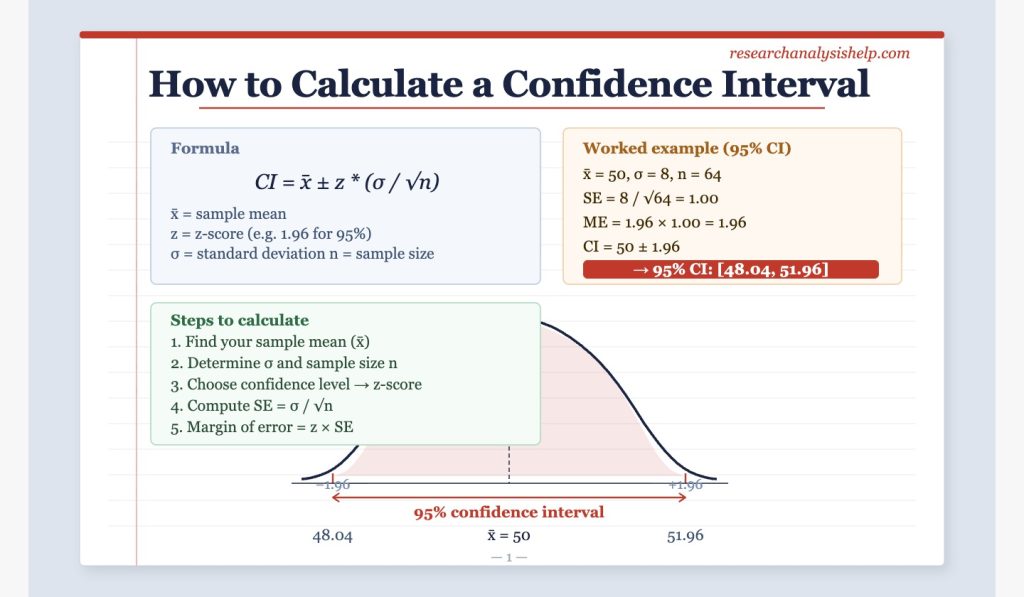
- Confidence Interval for the Population Mean (when population standard deviation is known): This is used when the population standard deviation is known, and the data is normally distributed. The formula to calculate this confidence interval is:
[
CI = \overline{X} \pm Z \times \frac{\sigma}{\sqrt{n}}
]
Where:
- ( \overline{X} ) = sample mean
- ( Z ) = Z-value corresponding to the chosen confidence level (e.g., 1.96 for 95% confidence)
- ( \sigma ) = population standard deviation
- ( n ) = sample size
- Confidence Interval for the Population Mean (when population standard deviation is unknown): When the population standard deviation is unknown, we use the t-distribution and the formula:
[
CI = \overline{X} \pm t \times \frac{s}{\sqrt{n}}
]
Where:
- ( s ) = sample standard deviation
- ( t ) = t-value corresponding to the degrees of freedom (df = n – 1)
- Confidence Interval for Proportions: Used when estimating the proportion of a population with a certain characteristic, such as the proportion of people who favor a specific policy. The formula is:
[
CI = \hat{p} \pm Z \times \sqrt{\frac{\hat{p}(1 – \hat{p})}{n}}
]
Where:
- ( \hat{p} ) = sample proportion
- ( n ) = sample size
How to Calculate a Confidence Interval
Step-by-Step Process:
- Identify the Sample Data:
- Obtain the sample mean (( \overline{X} )) and standard deviation (either sample standard deviation ( s ) or population standard deviation ( \sigma )) from the data.
- Choose the Confidence Level:
- The confidence level (e.g., 90%, 95%, 99%) determines how confident you are that the confidence interval contains the true population parameter.
- A higher confidence level results in a wider interval.
- Calculate the Standard Error:
- For means, the standard error (( SE )) is calculated as:
[
SE = \frac{s}{\sqrt{n}}
] - For proportions, the standard error is:
[
SE = \sqrt{\frac{\hat{p}(1 – \hat{p})}{n}}
]
Where: - ( n ) = sample size
- ( s ) = sample standard deviation or ( \sigma ) (population standard deviation)
- For means, the standard error (( SE )) is calculated as:
- Find the Z-Score or T-Value:
- If the population standard deviation is known, use the Z-table to find the Z-value for the desired confidence level.
- If the population standard deviation is unknown, use the t-distribution and find the t-value from the t-table based on the degrees of freedom (( n – 1 )).
- Calculate the Margin of Error:
- The margin of error is:
[
ME = Z \times SE \quad \text{(for z-test)} \quad \text{or} \quad ME = t \times SE \quad \text{(for t-test)}
]
- The margin of error is:
- Construct the Confidence Interval:
- The confidence interval is then:
[
CI = \overline{X} \pm ME
]
- The confidence interval is then:
Factors Affecting the Width of the Confidence Interval
The width of the confidence interval is influenced by several factors:
- Confidence Level:
- A higher confidence level (e.g., 99% vs. 95%) results in a wider interval because you want to be more certain that the interval contains the true population parameter.
- Sample Size:
- A larger sample size reduces the standard error, making the confidence interval narrower.
- Larger samples provide more precise estimates of the population parameter, which leads to a smaller margin of error.
- Standard Deviation:
- A larger standard deviation increases the standard error and thus results in a wider confidence interval. This indicates more variability in the data.
Examples of Confidence Interval Calculations
Example 1: Confidence Interval for the Population Mean
Suppose you are conducting a study on the mean height of 50 students. The sample mean is 170 cm, and the sample standard deviation is 10 cm. You want to calculate the 95% confidence interval for the population mean.
- Sample Mean (( \overline{X} )) = 170 cm
- Sample Standard Deviation (( s )) = 10 cm
- Sample Size (( n )) = 50
- Confidence Level = 95%
The Z-value for 95% confidence is 1.96.
- Calculate the Standard Error (SE):
[
SE = \frac{10}{\sqrt{50}} = 1.414
] - Calculate the Margin of Error (ME):
[
ME = 1.96 \times 1.414 = 2.77
] - Construct the Confidence Interval:
[
CI = 170 \pm 2.77
]
So, the confidence interval is [167.23 cm, 172.77 cm].
This means that we are 95% confident that the true population mean height lies between 167.23 cm and 172.77 cm.
Example 2: Confidence Interval for a Proportion
Suppose you survey 200 people, and 120 of them prefer a certain product. You want to calculate the 95% confidence interval for the proportion of people who prefer this product.
- Sample Proportion (( \hat{p} )) = ( \frac{120}{200} = 0.6 )
- Sample Size (( n )) = 200
- Confidence Level = 95%
The Z-value for 95% confidence is 1.96.
- Calculate the Standard Error (SE):
[
SE = \sqrt{\frac{0.6(1 – 0.6)}{200}} = 0.03464
] - Calculate the Margin of Error (ME):
[
ME = 1.96 \times 0.03464 = 0.0679
] - Construct the Confidence Interval:
[
CI = 0.6 \pm 0.0679
]
So, the confidence interval is [0.5321, 0.6679].
This means we are 95% confident that the true proportion of people who prefer the product is between 53.21% and 66.79%.
Need help with confidence intervals, hypothesis testing, and statistical analysis?
Whether you’re working with sample data, calculating confidence levels, or interpreting p-values, Research Analysis Help is here to guide you through every step.
Related Assignments for Mastering Confidence Intervals and Hypothesis Testing
These related assignments are designed to help you understand the essential concepts behind confidence intervals, p-values, and hypothesis testing. You will learn how to calculate confidence intervals, interpret confidence limits, and apply them to real-world data.
1. Calculating Confidence Intervals for Population Parameters
Assignment: Given a dataset, calculate the confidence interval for the population mean using the sample mean and standard deviation. Determine the margin of error and confidence limits based on a specified confidence level (e.g., 95% or 90%).
- Goal: Understand how to calculate confidence intervals around a point estimate and interpret the resulting interval estimate.
- Tools: Confidence interval formula, Z-table, T-distribution table.
- Key Terms: Confidence level, confidence limits, population mean, interval around the mean.
2. Using P Values and Calculate the Confidence Intervals in Hypothesis Testing
Assignment: Use a p-value in conjunction with confidence intervals to decide whether to reject or fail to reject the null hypothesis. Interpret the p-value and how it aligns with the confidence interval results. Discuss the relationship between p-values and the confidence level.
- Goal: Learn how p-values can help interpret the confidence interval and determine the significance of your findings.
- Tools: P-value calculator, Z-test, T-test.
- Key Terms: P-value, calculate the confidence interval, interpretation of confidence intervals.
3. Confidence Interval Practice: Interpreting the Results
Assignment: After calculating the confidence interval for a sample, interpret the results. For example, if you calculate a 95% confidence interval for the population mean, explain what it means in the context of the true population parameter. Discuss whether the interval contains the true value and how the confidence level influences your interpretation.
- Goal: Practice interpreting the confidence interval and understanding its implications on the true parameter.
- Tools: Confidence interval calculator, Z-table, interpretation guidelines.
- Key Terms: Confidence interval calculated, resulting intervals, true population mean.
4. Effect of Sample Size on Confidence Interval Width
Assignment: Calculate the confidence interval for a given sample size and standard deviation. Compare how the width of the confidence interval changes when the sample size increases or decreases. Discuss how larger sample sizes lead to narrower confidence intervals and greater precision in estimating the population parameter.
- Goal: Understand how sample size impacts the width of the confidence interval and the precision of the estimate.
- Tools: Confidence interval calculator, statistical software.
- Key Terms: Width of the interval, confidence limits, sample size, confidence interval is determined.
5. Computing Confidence Intervals for Unknown Populations
Assignment: Given a sample from an unknown population, calculate the confidence interval for the population mean. Interpret how the confidence interval helps estimate the true parameter and how it provides a range of values that the true population mean is likely to fall within.
- Goal: Learn how to calculate confidence intervals when the population mean is unknown and how the interval provides valuable estimates.
- Tools: T-distribution table, confidence interval formula.
- Key Terms: Unknown population, confidence interval for the population mean, true value.
6. Understanding the Concept of Confidence Interval Width and Confidence Level
Assignment: For a given dataset, calculate the confidence interval at 90% and 95% confidence levels. Discuss how confidence intervals change based on the chosen confidence level. For example, explain why a 95% confidence interval is wider than a 90% confidence interval.
- Goal: Explore the relationship between confidence levels and the width of the interval. Understand how a higher confidence level results in a wider interval.
- Tools: Confidence interval formula, Z-table, confidence level chart.
- Key Terms: Confidence level, width of the interval, confidence intervals around.
7. Factors Affecting the Confidence Interval Calculation
Assignment: Identify and analyze the factors that affect the confidence interval calculation. Focus on the role of standard deviation, sample size, and confidence level in determining the margin of error and the overall interval width. Calculate the confidence interval for different sample sizes and confidence levels.
- Goal: Understand how various factors, such as standard deviation and sample size, influence the resulting confidence interval.
- Tools: Confidence interval calculator, statistical analysis tools.
- Key Terms: Standard deviation, margin of error, confidence interval practice, interval calculated.
8. Comparing Confidence Intervals for Different Confidence Levels
Assignment: Calculate confidence intervals for a sample mean at different confidence levels (e.g., 90%, 95%, 99%). Compare the resulting intervals and discuss how the confidence level affects the width of the interval. Explain when to use different confidence levels based on the desired confidence and level of certainty.
- Goal: Learn to compare confidence intervals for various confidence levels and understand the trade-off between certainty and precision.
- Tools: Confidence interval formula, statistical software.
- Key Terms: Confidence level, interval calculated from a given sample, desired confidence level.
9. Confidence Interval Interpretation and Its Role in Statistical Analysis
Assignment: Given the confidence interval for a sample mean, explain what the interval tells you about the population mean. Discuss the interpretation of confidence intervals and how they can help estimate the true population parameter in statistical studies.
- Goal: Develop a clear understanding of how to interpret confidence intervals and explain their significance in hypothesis testing and statistical inference.
- Tools: Z-table, confidence interval software.
- Key Terms: Interval estimate, confidence intervals help, true mean, statistical significance.
10. Applying Confidence Intervals in Real-World Scenarios
Assignment: Use real-world data (e.g., survey results, test scores) to calculate the confidence interval for the mean. Discuss how the confidence interval can be used to make informed decisions and estimate the true parameter in fields such as healthcare, economics, or education.
- Goal: Learn how to apply confidence intervals to real-world data and draw meaningful conclusions about population parameters.
- Tools: Data analysis software, confidence interval formula.
- Key Terms: True parameter, real-world, population mean lies, confidence intervals around.
These related assignments will help you enhance your understanding of confidence intervals and how they are used in statistical analysis. Whether you’re calculating intervals for a population mean, interpreting the confidence level, or working with real-world data, these exercises will provide valuable practice and insights into the power of confidence intervals.
For expert help with your statistical analysis or assistance in confidence interval calculations, Research Analysis Help is here to support you!
📧 Contact us now at Research Analysis Help for personalized assistance with your statistical testing! 📊
Conclusion
Calculating and interpreting confidence intervals is a vital part of statistical analysis. By understanding how to calculate confidence intervals, determine the width, and interpret the results, you can draw accurate conclusions about population parameters based on sample data.
At Research Analysis Help, we provide expert guidance on calculating confidence intervals, hypothesis testing, and interpreting statistical data. If you need assistance with any statistical analysis or need help with your confidence interval practice, contact us today!
📧 Contact us now at Research Analysis Help for personalized support with your statistical analysis! 📊
Final Thoughts
Calculating and interpreting confidence intervals is a crucial skill in statistical analysis. Whether you are estimating the true population mean or analyzing sample data, understanding how to calculate confidence intervals and their associated confidence levels will help you make more informed decisions in your research.
At Research Analysis Help, we specialize in statistical analysis and can help you with calculating confidence intervals, interpreting p-values, and making sense of your data. If you’re working on confidence interval practice or need help with hypothesis testing, don’t hesitate to reach out.
📧 Contact us today at Research Analysis Help for expert assistance with your statistical analysis! 📊
FAQs:
How Do I Calculate a 95% Confidence Interval?
To calculate a 95% confidence interval, follow these steps:
- Determine the Point Estimate: Typically, this is the sample mean (( \overline{X} )), which is your best estimate of the true population mean.
- Find the Standard Error (SE): The standard error of the mean (( SE )) is calculated using the formula: [
SE = \frac{s}{\sqrt{n}}
] Where:- ( s ) = sample standard deviation
- ( n ) = sample size
- Calculate the Confidence Interval: For a 95% confidence interval, use the Z-score for 95% confidence, which is 1.96 (for a large sample size) or use the t-score for smaller samples. The formula for the confidence interval is: [
CI = \overline{X} \pm (Z \times SE)
] Where:- ( \overline{X} ) = sample mean
- ( Z ) = Z-score for the desired confidence level (1.96 for 95%)
- ( SE ) = standard error of the mean
- Interpretation: The resulting confidence interval provides a range of values that is likely to contain the true population mean. With 95% confidence, we can say the true mean lies within this interval, given the sample data.
Is a 5% Significance Level the Same as a 95% Confidence Interval?
No, a 5% significance level (often denoted as ( \alpha = 0.05 )) and a 95% confidence interval are related but not the same thing.
- 5% Significance Level: This is the probability of rejecting the null hypothesis when it is actually true (Type I error). It corresponds to the critical value used in hypothesis testing.
- 95% Confidence Interval: This refers to a range of values that, with 95% certainty, contains the true population parameter. In other words, if you were to repeat the sampling process many times, 95% of the intervals calculated would contain the true population mean.
The confidence interval and significance level are related through the p-value. If a p-value is less than 0.05, the null hypothesis is typically rejected, and the confidence interval does not contain the null hypothesis value (e.g., the population mean).
Do You Always Use 1.96 for a 95% Confidence Interval?
No, you do not always use 1.96 for a 95% confidence interval. While 1.96 is the Z-score commonly used when the population standard deviation is known or when the sample size is large, this value can change depending on:
- Small Sample Sizes: For smaller sample sizes, you should use the t-distribution, and the corresponding t-value will depend on the degrees of freedom (( n – 1 )).
- Standard Error: The standard error plays a key role in determining the width of the confidence interval. As the sample size increases, the standard error decreases, leading to a narrower interval.
- Confidence Levels: The Z-score for a 95% confidence interval is 1.96, but for other confidence levels, like 99% or 90%, the Z-score changes. For example:
- 90% confidence level: Z = 1.645
- 99% confidence level: Z = 2.576
So, the Z-value changes depending on the confidence level and the specific sample data used.
Is a 90% or 95% Confidence Interval Better?
The choice between a 90% and 95% confidence interval depends on the level of certainty you require and the trade-off between confidence and precision:
- 90% Confidence Interval:
- A 90% confidence interval gives you 90% confidence that the true population parameter lies within the interval.
- This interval will be narrower because the confidence level is lower, meaning you are accepting more uncertainty in exchange for a more precise estimate.
- 95% Confidence Interval:
- A 95% confidence interval gives you 95% confidence that the true population parameter lies within the interval.
- This interval is wider because you are demanding greater certainty in the estimate, which means more range for the possible values of the population parameter.
Which One to Choose?
- If you need greater precision (a narrower interval), use a 90% confidence interval.
- If you need more certainty (to contain the true value with a higher probability), use a 95% confidence interval.
In general, 95% is the standard used in most fields of statistical analysis, but 90% may be chosen in situations where a wider range of plausible values is acceptable.
Key Concepts to Remember:
- Confidence Interval: A range of values likely to contain the true population parameter. It is based on the sample mean, standard error, and confidence level.
- Z-Score and T-Score: The Z-score is used when the population standard deviation is known and the sample size is large. For smaller samples, use the t-distribution and t-values.
- Factors Affecting Confidence Interval:
- Confidence Level: Higher confidence (e.g., 99%) leads to a wider interval.
- Sample Size: Larger samples reduce standard error and create narrower intervals.
- Standard Deviation: Greater variance in the data increases the width of the interval.
- Margin of Error: The margin of error affects the width of the confidence interval. It represents the uncertainty around the point estimate (e.g., sample mean).