What To Know
- The normal distribution table (often called the z-table) is a chart that helps you find the probability of a data point occurring within a normal distribution.
- For a negative z-score, you would look up the corresponding value for the positive z-score and subtract it from 1 to find the area to the left of the negative value.
How to Use the Normal Distribution Table: A Step-by-Step Guide
In statistics, the normal distribution is one of the most important concepts. It is often referred to as the bell curve because of its symmetrical, bell-shaped appearance when plotted on a graph. Z-scores are used to standardize data to fit this distribution, and learn how to use normal distribution table (or z-table) is an essential tool to find probabilities and percentages related to these z-scores.
In this blog post, we will walk you through how to use the normal distribution table effectively, including examples, calculations, and explanations of key concepts like z-scores, the standard normal distribution, and how to apply these to real-world situations.
What is the Normal Distribution Table?
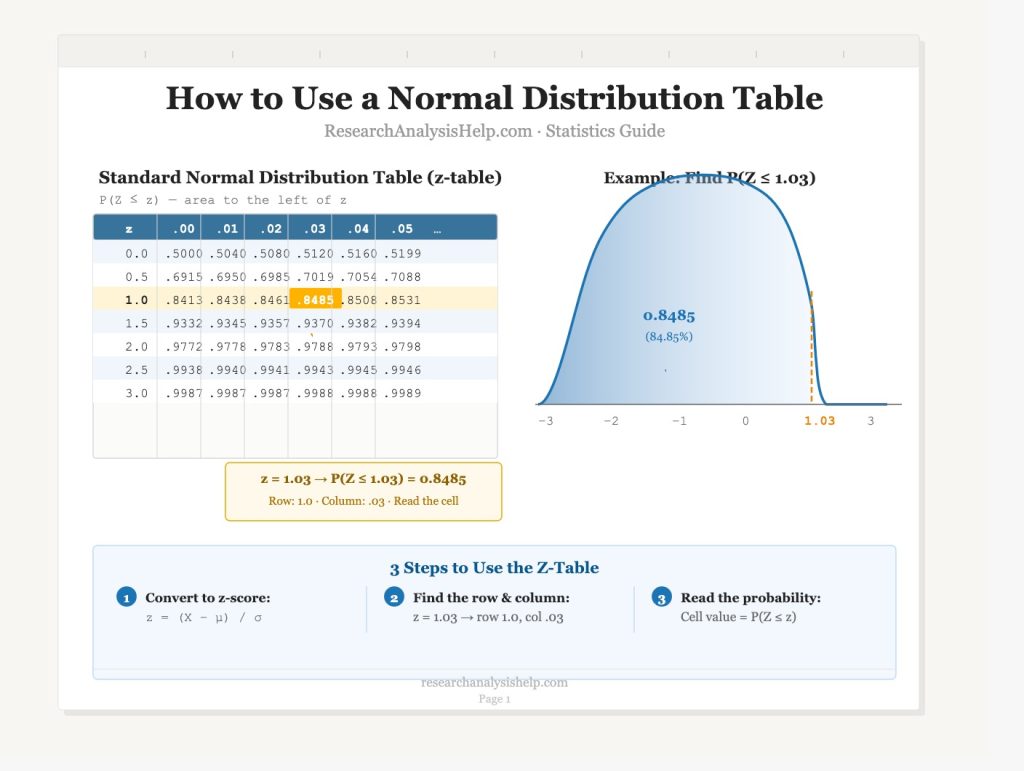
The normal distribution table (often called the z-table) is a chart that helps you find the probability of a data point occurring within a normal distribution. It is based on the standard normal distribution, which is a specific normal distribution where:
- The mean is 0.
- The standard deviation is 1.
The table provides the cumulative probability associated with different z-scores. A z-score tells you how many standard deviations a particular data point (x) is from the mean.
Understanding Z-Scores and the Standard Normal Distribution
What is a Z-Score?
A z-score represents the number of standard deviations a data point is away from the mean. The formula to calculate a z-score is:
[
z = \frac{x – \mu}{\sigma}
]
Where:
- ( x ) = the data point
- ( \mu ) = the mean of the distribution
- ( \sigma ) = the standard deviation
A positive z-score means the data point is above the mean, while a negative z-score means it is below the mean. For example, a z-score of 1.2 means the data point is 1.2 standard deviations greater than the mean.
How to Use the Normal Distribution Table
Step 1: Calculate the Z-Score
To use the normal distribution table, you first need to calculate the z-score for the data point in question. For example, if you have a data point of 130, a mean of 100, and a standard deviation of 15, the z-score would be:
[
z = \frac{130 – 100}{15} = 2.0
]
Step 2: Find the Z-Score in the Table
Once you have the z-score, use the standard normal distribution table (also called the z-table) to find the corresponding probability. The table lists the z-scores along the leftmost column and the top row. To find the probability associated with a z-score of 2.0:
- Look at the row labeled 2.0 in the left column.
- Look at the column labeled 0.00 in the top row (for a z-score of 2.00).
The value at the intersection is 0.9772, which represents the cumulative probability from the left side of the distribution. This means that 97.72% of the data points fall below a z-score of 2.0.
Step 3: Interpret the Probability
The z-table gives you the cumulative probability, which is the area under the curve to the left of the z-score. For a z-score of 2.0, the area (or probability) is 0.9772, which means that there is a 97.72% chance that a data point is less than or equal to 130 in this dataset.
- For two-sided tests, the probability would be doubled if you’re looking for values that are both positive and negative.
- For a negative z-score, you would look up the corresponding value for the positive z-score and subtract it from 1 to find the area to the left of the negative value.
Example: Using the Z-Table for a Real-World Scenario
Problem:
Let’s say you are testing the test scores of students in a class. The mean score is 80, and the standard deviation is 10. A student scored 90 on the test. You want to know the probability of a student scoring 90 or less.
Solution:
- Calculate the Z-Score:
[
z = \frac{90 – 80}{10} = 1.0
] - Find the Probability from the Z-Table:
- From the z-table, the value for z = 1.0 is 0.8413.
- Interpret the Probability:
- This means there is an 84.13% probability that a randomly selected student will score 90 or less on the test.
Negative Z-Scores and Finding Probabilities Below the Mean
If the z-score is negative, the probability represents the area to the left of the mean. For example, if you calculate a z-score of -1.2:
- Z-Score = -1.2 means the data point is 1.2 standard deviations below the mean.
- From the z-table, the corresponding value is 0.1151, which means that 11.51% of the data lies below a z-score of -1.2.
Example:
If the mean test score is 80 and the standard deviation is 10, a test score of 70 would have a z-score of -1.0:
[
z = \frac{70 – 80}{10} = -1.0
]
Looking up z = -1.0 in the z-table, the cumulative probability is 0.1587, meaning that 15.87% of students scored below 70.
Using the Z-Table for Two-Sided and One-Sided Tests
One-Sided Test:
In a one-tailed test, you are interested in the probability of a value being either greater than or less than a certain z-score. For instance:
- A z-score of 2.0 in a one-tailed test represents the area to the right, which is ( 1 – 0.9772 = 0.0228 ) (i.e., 2.28% of the data points fall above this score).
Two-Sided Test:
In a two-tailed test, you are interested in the probability of a value being greater than or less than a certain z-score in either direction. For instance:
- A z-score of ±1.96 represents the critical values for a 95% confidence interval. The area between -1.96 and +1.96 corresponds to 95% of the data, with 2.5% in each tail.
Need help with z-scores, normal distribution, and hypothesis testing?
Whether you’re analyzing real-world data, calculating probabilities, or interpreting p-values, Research Analysis Help is here to guide you every step of the way.
Related Assignments to Master the Standard Normal Distribution Table
These related assignments will help you understand the standard normal distribution table, how to apply it in hypothesis testing, and how to interpret the proportion of data points under the normal curve. You’ll also learn how to calculate cumulative probabilities and use the standard normal distribution in real-world scenarios.
1. Using the Standard Normal Distribution Table to Calculate Proportions
Assignment: Given a z-score, use the standard normal distribution table to find the cumulative probability (or proportion) associated with it. Calculate the probability of a random variable falling below a specific z-score in the standard normal distribution.
- Goal: Learn to use the standard normal table to find the cumulative probability for a z-score, and understand how to calculate proportions for a normal distribution.
- Tools: Standard normal distribution table, p-value calculator.
- Key Terms: Cumulative distribution function, mean value, standard deviation of one, bell curve.
2. Applying the Standard Normal Table for Probability Calculations
Assignment: For a given dataset, calculate the z-score for a specific data point and use the standard normal distribution table to find the cumulative probability. Interpret the proportion of data points below that value and explain the significance of cumulative probabilities in hypothesis testing.
- Goal: Apply the standard normal table to calculate the probability that a data point falls below a given z-score.
- Tools: Standard normal table, z-score formula.
- Key Terms: Proportion, using the cumulative distribution, mean of zero, observed data.
3. Interpreting Proportions from the Standard Normal Distribution
Assignment: For a z-score of 1.5, find the corresponding proportion of values in the standard normal distribution using the standard normal table. Discuss the area under the curve and how it represents the probability of a data point falling within a certain range.
- Goal: Understand how to interpret the proportion of data points below a specific z-score and how this relates to the cumulative distribution function.
- Tools: Standard normal distribution table, normal distribution function.
- Key Terms: Proportion, negative infinity, cumulative distribution, standard normal.
4. Calculating Probabilities Using the Standard Normal Table
Assignment: Given a z-score, use the standard normal distribution table to find the cumulative probability. Apply this to calculate the probability that a random variable lies between two z-scores (e.g., between 1.0 and 2.0).
- Goal: Learn how to find the probability between two z-scores using the standard normal distribution table and understand the area between the z-scores.
- Tools: Standard normal table, calculator for cumulative probability.
- Key Terms: Cumulative distribution, percent, function of a standard normal distribution, horizontal axis.
5. Understanding the Concept of Negative and Positive Z-Scores
Assignment: Calculate the z-score for a given data point and use the standard normal distribution table to find the probability. Discuss how negative z-scores represent values below the mean, and positive z-scores represent values above the mean. Include an example showing both positive and negative probabilities.
- Goal: Understand the difference between positive and negative z-scores and how the normal distribution yields different probabilities for each.
- Tools: Z-table, statistical software.
- Key Terms: Z-scores, negative infinity, standard normal distribution, mean of zero.
6. Using the Cumulative Distribution Function for Hypothesis Testing
Assignment: Using the standard normal table, find the p-value for a given z-score. Apply this to hypothesis testing, where you will use the cumulative distribution to decide whether to reject or fail to reject the null hypothesis.
- Goal: Learn how the cumulative distribution function is applied in hypothesis testing and how p-values relate to z-scores.
- Tools: Z-table, critical value calculator.
- Key Terms: Cumulative distribution, p-value approach, reject the null hypothesis, significance level.
7. Proportions and Percentages in Real-World Data Using Z-Scores
Assignment: In a real-world scenario, use the standard normal distribution table to find the proportion of data points that fall above or below a specific z-score. Calculate this using cumulative probabilities and apply it to evaluate a real-world data set (such as test scores, height distributions, etc.).
- Goal: Understand how proportions and percentages are calculated and interpreted using the normal distribution in practical applications.
- Tools: Standard normal table, statistical software.
- Key Terms: Proportion, real-world data, normal curve, data values.
8. Comparing Two Z-Scores to Find Probability Differences
Assignment: Given two z-scores, calculate the probability that a random variable falls between these two values using the standard normal distribution table. Compare the probabilities and interpret the difference.
- Goal: Learn to compare two z-scores and calculate the difference in probabilities to better understand the range of values under the normal curve.
- Tools: Z-table, cumulative distribution function.
- Key Terms: Difference between two, z-scores, calculate.
9. Finding Probabilities in Both Tails of the Distribution
Assignment: Use the standard normal distribution table to find the probabilities for two-tailed tests. Calculate the area in both the left and right tails of the normal curve, and apply this to a hypothesis test.
- Goal: Understand how to calculate the total probability for both tails of the distribution and use this in statistical testing.
- Tools: Z-table, p-value calculator.
- Key Terms: Two-sided p-value, normal curve, area, critical value.
10. Apply the Standard Normal Table in Real-World Scenarios
Assignment: Given a real-world example (e.g., test scores of a class), use the standard normal table to calculate the probability that a student scores below a certain value. Discuss how this applies to decision-making in education, finance, or any relevant field.
- Goal: Apply the standard normal distribution table to real-world data and use it to make informed decisions.
- Tools: Standard normal table, statistical analysis tools.
- Key Terms: Real-world, proportion, cumulative distribution, data entry.
These related assignments are designed to help you effectively use the standard normal distribution table in hypothesis testing, calculating probabilities, and making informed decisions based on z-scores. Whether you’re working with real-world data or applying these concepts to theoretical problems, mastering these techniques will enhance your statistical analysis skills.
For personalized assistance with normal distribution calculations, hypothesis testing, or any other statistical analysis, Research Analysis Help is here to support you!
📧 Contact us now at Research Analysis Help for expert guidance in your statistical studies! 📊
Conclusion: Why Use the Normal Distribution Table?
The normal distribution table (or z-table) is an essential tool for calculating probabilities and understanding how data points are distributed in a standard normal distribution. By learning how to use the z-table, you can:
- Calculate p-values for hypothesis tests.
- Find probabilities for various z-scores.
- Interpret test results to decide whether to reject the null hypothesis.
At Research Analysis Help, we offer expert assistance in statistical analysis, helping you understand how to use the normal distribution table, calculate z-scores, and apply these concepts to real-world data. If you need help with hypothesis testing or statistical analysis, reach out to our team today!
📧 Contact us now at Research Analysis Help for personalized assistance with data analysis and hypothesis testing! 📊
Final Thoughts
Using the normal distribution table is a critical skill in statistics, allowing you to find probabilities, interpret z-scores, and make informed decisions in hypothesis testing. Whether you are calculating p-values, working with two-tailed or one-tailed tests, or analyzing real-world data, the z-table provides a simple and effective way to understand the distribution of data and assess the statistical significance of your results.
At Research Analysis Help, we provide expert guidance in statistical analysis, helping you apply the normal distribution, calculate p-values, and interpret your results with confidence. If you need assistance with hypothesis testing, normal distribution, or z-scores, don’t hesitate to reach out!
📧 Contact us today at Research Analysis Help for personalized assistance with your statistical analysis! 📊
FAQs:
How to Use the Normal Distribution Function Table?
The normal distribution function table, also known as the z-table, is an essential tool used to find the probability that a random variable falls below a specific z-score in a standard normal distribution. Here’s how you can use it:
- Find the Z-Score: To use the table, first, you need to calculate the z-score. The formula for the z-score is:
[
z = \frac{x – \mu}{\sigma}
]
Where:
- ( x ) = the data point
- ( \mu ) = the mean of the distribution
- ( \sigma ) = the standard deviation (for a standard normal distribution, ( \sigma = 1 ))
- Use the Z-Score to Find the Probability: Once you have the z-score, look it up in the z-table. The z-table provides the cumulative probability for a z-score, which represents the area under the normal curve to the left of the z-score.
- The table gives you the proportion of values below the z-score.
- For positive z-scores, find the row for the z-score and the column for the second digit after the decimal point. For example, if the z-score is 1.23, find the row for 1.2 and the column for 0.03.
- For negative z-scores, the table will give you the proportion to the left of the mean (zero). Simply look up the corresponding positive z-score and subtract the value from 1 to get the proportion to the right.
What is a 68% Normal Distribution?
A 68% normal distribution refers to the empirical rule (or 68-95-99.7 rule) in statistics, which states that in a normal distribution:
- 68% of the data values lie within one standard deviation of the mean.
- This means that 68% of the data is concentrated around the mean (in the bell-shaped curve of a normal distribution), making it a central range in the distribution.
Important to understand:
- 68% of the values are within ±1 standard deviation from the mean.
- This range is useful when estimating probabilities for normally distributed data, as it represents a high proportion of the data values.
How Do You Read a Z-Score Table?
To read a z-score table, follow these steps:
- Locate the Z-Score:
- The z-score is typically represented with a decimal. For example, if your z-score is 1.23, you’ll look for 1.2 in the rows and 0.03 in the columns.
- Find the Corresponding Probability:
- The table gives the cumulative probability, which is the proportion of the data to the left of the z-score on the normal curve.
- For example, a z-score of 1.23 gives a probability of 0.8907, meaning 89.07% of the data points are below a z-score of 1.23.
- Interpret the Value:
- If the z-score is positive, the z-table provides the cumulative probability to the left of the z-score.
- If the z-score is negative, you can look up the positive equivalent of the z-score and subtract the table value from 1 to find the area to the right of the mean.
This helps to determine the probability that a random variable (data point) will fall within a specific range.
What is the Value of 0.05 in the Z Table?
In a z-table, the value of 0.05 represents the level of significance commonly used in hypothesis testing. Specifically:
- 0.05 is often used as a threshold for deciding whether to reject the null hypothesis in a statistical test.
- If the p-value (the probability value) is less than 0.05, you reject the null hypothesis and conclude that there is sufficient evidence to support the alternative hypothesis.
- The z-score corresponding to a p-value of 0.05 is typically around 1.96 in a two-tailed test (which means that 95% of the data falls within ±1.96 standard deviations from the mean).
Here’s how to read it in the z-table:
- For a one-tailed test at the 0.05 significance level, look for the z-score corresponding to 0.95 (since 95% is the area to the left of the z-score in the normal distribution).
- The z-score for 0.95 is approximately 1.645.
Key Points to Remember When Using the Normal Distribution Table
- Z-Scores: The z-score is a measure of how far a data point is from the mean in terms of standard deviations.
- Standard Normal Distribution: The standard normal distribution has a mean of 0 and a standard deviation of 1, making it easier to calculate probabilities for normally distributed data.
- Z-Table Use: The z-table helps you find the probability of a z-score by providing the cumulative area to the left of the z-score on the normal curve.
- 68-95-99.7 Rule: About 68% of the data lies within ±1 standard deviation from the mean, 95% lies within ±2 standard deviations, and 99.7% lies within ±3 standard deviations.
- Interpreting the Results:
- A small p-value (like 0.001) means the result is statistically significant.
- A larger p-value (greater than 0.05) suggests that the result is not statistically significant and you fail to reject the null hypothesis.