What To Know
- For an even number of data points in the lower half, Q1 is the average of the two middle values.
- For an even number of data points in the upper half, Q3 is the average of the two middle values.
How to Find Q1 and Q3: A Complete Guide to Quartiles and the Interquartile Range
When analyzing data, quartiles are essential to understanding the distribution and spread of a dataset. Q1 (the first quartile) and Q3 (the third quartile) are key components in summarizing a set of data and are often used in creating box and whisker plots. In this blog post, we will dive into how to find Q1 and Q3, explaining their significance, providing step-by-step instructions, and offering helpful examples along the way.
What Are Quartiles?
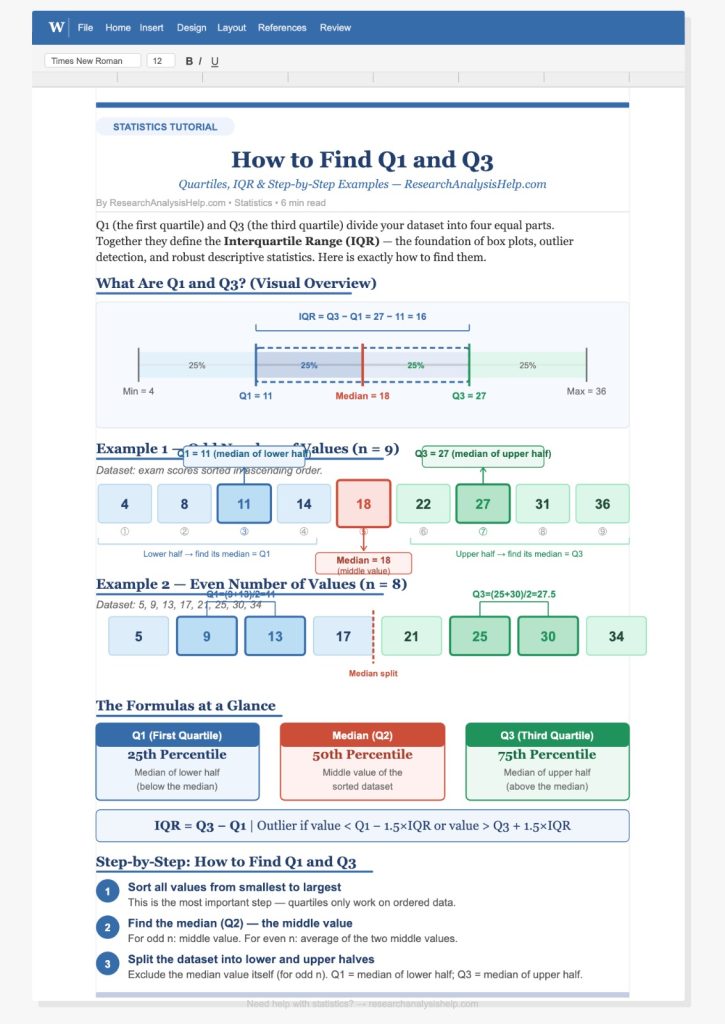
Quartiles are values that divide a set of data into four equal parts. They are used to measure the spread of the data and provide insight into how data points are distributed across the range.
There are three main quartiles:
- Q1 (First Quartile) – The 25th percentile of the data, marking the lower 25%.
- Q2 (Second Quartile) – The 50th percentile, or the median, splitting the data into two halves.
- Q3 (Third Quartile) – The 75th percentile, marking the upper 25% of the data.
Together, Q1, Q2, and Q3 create the five-number summary of a dataset, which also includes the minimum and maximum values. These quartiles give you a clear understanding of how the data is distributed and where the central tendency lies.
The Importance of Q1 and Q3 in Statistical Analysis
The first quartile (Q1) represents the lower 25% of the dataset, and the third quartile (Q3) represents the upper 25%. These quartiles are crucial in understanding the interquartile range (IQR), which is the difference between Q3 and Q1:
[
\text{IQR} = Q3 – Q1
]
The IQR is a measure of the spread of the middle 50% of the data, and it helps to identify outliers. Data points that fall below ( Q1 – 1.5 \times \text{IQR} ) or above ( Q3 + 1.5 \times \text{IQR} ) are often considered outliers.
Step-by-Step Guide on How to Find Q1 and Q3
Step 1: Organize the Data
To calculate Q1 and Q3, your data needs to be organized. Follow these steps:
- Arrange the dataset in ascending order (from the smallest value to the largest).
- If you have an odd number of data points, the middle value is the median. If you have an even number of data points, the median is the average of the two middle values.
Step 2: Find the Median (Q2)
The median or second quartile (Q2) is the middle value of your ordered dataset. This value divides the data set into two halves.
- For an odd number of data points: The median is the middle number.
- For an even number of data points: The median is the average of the two middle numbers.
Step 3: Divide the Data Set Into Lower and Upper Halves
Once you’ve found the median (Q2):
- The lower half of the data includes all the values below the median.
- The upper half includes all the values above the median.
These halves will help in finding Q1 and Q3.
Step 4: Calculate Q1 (The First Quartile)
To find Q1, you need to calculate the median of the lower half of the data.
- For an odd number of data points in the lower half, Q1 is the middle value.
- For an even number of data points in the lower half, Q1 is the average of the two middle values.
Step 5: Calculate Q3 (The Third Quartile)
To find Q3, calculate the median of the upper half of the data.
- For an odd number of data points in the upper half, Q3 is the middle value.
- For an even number of data points in the upper half, Q3 is the average of the two middle values.
Example of Finding Q1 and Q3
Let’s consider the following set of data:
5, 8, 12, 16, 20, 22, 28, 30, 34, 35
Step 1: Arrange the Data in Order
Already arranged as: 5, 8, 12, 16, 20, 22, 28, 30, 34, 35.
Step 2: Find the Median (Q2)
There are 10 data points (an even number), so the median is the average of the 5th and 6th values:
[
Q2 = \frac{20 + 22}{2} = 21
]
Step 3: Divide the Data into Two Halves
- Lower half: 5, 8, 12, 16, 20
- Upper half: 22, 28, 30, 34, 35
Step 4: Find Q1 (Median of Lower Half)
The lower half has 5 data points (an odd number), so the middle value is the third value: Q1 = 12.
Step 5: Find Q3 (Median of Upper Half)
The upper half also has 5 data points (an odd number), so the middle value is the third value: Q3 = 30.
Box and Whisker Plot and Quartiles
A box and whisker plot (or box plot) is a great way to visually represent Q1, Q2 (median), and Q3 along with the minimum and maximum values. This plot divides your data into four parts, and the interquartile range (IQR) visually represents the spread of the middle 50% of the data.
- The box shows the interquartile range (IQR), spanning from Q1 to Q3.
- The line inside the box represents the median (Q2).
- The whiskers extend from the box to the minimum and maximum values.
- Outliers are shown as points outside the whiskers.
Software Tools for Finding Quartiles
While manually calculating Q1 and Q3 is straightforward, it can become time-consuming with larger datasets. Thankfully, there are several software tools that can help:
- Excel: You can use the QUARTILE function in Excel to calculate Q1, Q2, and Q3 easily.
- Formula:
=QUARTILE(A1:A10, 1)for Q1,=QUARTILE(A1:A10, 3)for Q3.
- Formula:
- R: The quantile function can help you calculate the quartiles efficiently.
- Python: Libraries like NumPy or Pandas offer built-in methods to calculate quartiles.
- Example in Python:
numpy.percentile(data, 25)for Q1 andnumpy.percentile(data, 75)for Q3.
- Example in Python:
Need help in quartiles and statistical analysis?
Whether you need help calculating Q1, Q3, or creating a box and whisker plot, ResearchAnalysisHelp.com is here to assist you.
Here are some related assignments that will help you practice and enhance your understanding of quartiles, interquartile range (IQR), and statistical analysis:
1. Calculate Quartiles for a Given Set of Data
- Assignment: Given a set of data, calculate Q1, Q2 (median), and Q3. Use these quartiles to determine the interquartile range (IQR) and identify any potential outliers.
- Goal: Learn how to manually calculate quartiles and IQR from a dataset.
- Tools: Excel, R, or Python.
2. Create a Box and Whisker Plot
- Assignment: Using the quartiles (Q1, Q2, Q3), minimum, and maximum values, create a box and whisker plot. Interpret the plot to understand the spread of the data and identify any outliers.
- Goal: Visualize quartiles using a box plot and understand how they represent the distribution of data.
- Tools: Microsoft Excel or any graphing software.
3. Comparison of Quartiles Across Multiple Data Sets
- Assignment: Compare the Q1, Q2, and Q3 values of two or more data sets. Analyze the differences in spread and central tendency between the datasets, and discuss the significance of these differences.
- Goal: Practice comparing multiple datasets using quartiles and interquartile ranges.
- Tools: Microsoft Excel, SPSS, or R.
4. Use Quartiles to Identify Outliers
- Assignment: Calculate the IQR for a dataset and use the formula to identify any outliers. Discuss the implications of these outliers on the overall data analysis.
- Goal: Understand how to use quartiles and IQR to detect and handle outliers.
- Tools: Excel or statistical software.
5. Calculate the Quartile Deviation
- Assignment: Given a dataset, calculate the quartile deviation (the difference between Q3 and Q1 divided by 2). Interpret the result to assess the spread of the middle 50% of the data.
- Goal: Learn how to calculate and interpret the quartile deviation as a measure of data spread.
- Tools: Excel, R, or Python.
6. Interpret Quartiles in the Context of Statistical Testing
- Assignment: Given a dataset, calculate Q1, Q2, Q3, and the IQR. Use these values to inform a statistical hypothesis test, such as a t-test or ANOVA, and interpret the results in terms of quartiles and significance levels.
- Goal: Connect quartile calculations with statistical testing methods and learn how quartiles contribute to the overall analysis.
- Tools: Excel, SPSS, or R.
7. Calculate and Compare Quartiles for Grouped Data
- Assignment: For a given set of grouped data, calculate the quartiles using the cumulative frequency method. Compare the quartiles for different groups or categories and analyze how they relate to each other.
- Goal: Practice calculating quartiles for grouped data and interpreting their implications in data analysis.
- Tools: Excel, R, or Python.
8. Using Quartiles to Determine Skewness
- Assignment: Given a dataset, calculate Q1, Q2, and Q3, and use these to determine the skewness of the distribution. If the median is closer to Q1, the data is right-skewed; if it’s closer to Q3, the data is left-skewed. Analyze the results.
- Goal: Understand how quartiles can help determine the skewness of data distributions.
- Tools: Excel, R, or Python.
9. Calculate Quartiles for a Large Data Set Using Software
- Assignment: Given a large dataset, use software (like Excel, R, or Python) to calculate Q1, Q2, and Q3 efficiently. Interpret the quartiles in terms of data spread, variability, and outliers.
- Goal: Learn how to calculate quartiles for large datasets using statistical software.
- Tools: Excel, R, or Python.
10. Quartile-Based Segmentation Analysis
- Assignment: Use quartiles to segment a dataset into four groups: the first quartile, second quartile, third quartile, and fourth quartile. Analyze the characteristics of each segment (e.g., sales performance, age groups, etc.) and provide insights.
- Goal: Understand how to use quartiles to perform segmentation analysis and gain deeper insights into the data.
- Tools: Excel, SPSS, or R.
These assignments will help you develop a deeper understanding of quartiles, interquartile ranges, and statistical analysis. By applying these concepts to real-world data, you’ll become proficient at using quartiles to analyze, visualize, and interpret data efficiently.
Conclusion
Finding Q1 and Q3 is a fundamental task in statistical analysis that helps you understand the spread of the data and identify outliers. By using the interquartile range (IQR) and creating a box and whisker plot, you can visualize the distribution of your data and make more informed decisions.
At Research Analysis Help, we provide expert assistance in data analysis and statistical testing, helping you efficiently calculate quartiles and visualize your data. If you’re working with large datasets and need guidance on statistical methods, reach out to us for personalized support!
Final Thoughts
Q1, Q2, and Q3 are essential statistical measures used to understand the spread and distribution of a dataset. By calculating the quartiles, you can gain valuable insights into the middle 50% of the data and identify any outliers. Whether you are working with small or large datasets, knowing how to calculate Q1, Q2, and Q3 helps you analyze data effectively.
If you’re struggling with statistics or need further assistance in calculating quartiles and creating box and whisker plots, Research Analysis Help is here for you. Our experts can guide you through quartile calculations, help you identify patterns in your data, and provide the tools you need for successful statistical analysis.
📧 Reach out now at Research Analysis Help to get started! 📊
FAQs:
What is the 3rd Quartile of 33, 25, 42, 25, 31, 37, 46, 29, 38?
To find the third quartile (Q3) of the dataset:
33, 25, 42, 25, 31, 37, 46, 29, 38, follow these steps:
- Order the data in ascending order:
25, 25, 29, 31, 33, 37, 38, 42, 46 - Find the median (Q2):
- The median is the middle value of the ordered data.
- With 9 data points, the median is the 5th value, which is 33.
- Divide the data into two halves:
- Lower half: 25, 25, 29, 31
- Upper half: 37, 38, 42, 46
- Find the third quartile (Q3):
- The third quartile is the median of the upper half.
- For the upper half 37, 38, 42, 46, the median is the average of the 2nd and 3rd values:
[
Q3 = \frac{38 + 42}{2} = 40
]
So, the third quartile (Q3) of the data is 40.
What is the Formula for Q1?
The formula for Q1 (the first quartile) is essentially the median of the lower half of the dataset. To find Q1, follow these steps:
- Arrange the data in ascending order.
- Find the median (Q2).
- Split the data into two halves: One for the lower half (below Q2) and one for the upper half (above Q2).
- Q1 is the median of the lower half of the data.
For example, in an ordered dataset [2, 5, 7, 8, 14, 15, 17, 27], the lower half is [2, 5, 7, 8], and the median of the lower half is 6.
Thus, the formula for Q1 is:
[
Q1 = \text{Median of lower half of the data}
]
How to Identify Q1, Q2, and Q3?
To identify the first quartile (Q1), second quartile (Q2), and third quartile (Q3), follow these steps:
- Arrange the data in ascending order.
- Find Q2 (the median):
- If the dataset has an odd number of observations, Q2 is the middle value.
- If the dataset has an even number of observations, Q2 is the average of the two middle values.
- Divide the data into two halves:
- Lower half: The data points less than the median.
- Upper half: The data points greater than the median.
- Find Q1:
- Q1 is the median of the lower half of the data.
- Find Q3:
- Q3 is the median of the upper half of the data.
For example, for the ordered dataset [2, 5, 7, 8, 14, 15, 17, 27]:
- Q2 (median) is the average of 8 and 14, which gives 11.
- The lower half is [2, 5, 7, 8], so Q1 (median of the lower half) is 6.
- The upper half is [14, 15, 17, 27], so Q3 (median of the upper half) is 16.
Thus:
- Q1 = 6
- Q2 = 11
- Q3 = 16
What is the Quartile Deviation of 17, 2, 7, 27, 15, 5, 14, 8?
The quartile deviation (QD) is the difference between Q3 and Q1, divided by 2. It measures the spread of the middle 50% of the data and is a robust measure of variability. To calculate the quartile deviation, follow these steps:
- Arrange the data in ascending order:
[2, 5, 7, 8, 14, 15, 17, 27] - Find Q1:
- The lower half of the data is [2, 5, 7, 8], so the median is 6.
- Find Q3:
- The upper half of the data is [14, 15, 17, 27], so the median is 16.
- Calculate the Quartile Deviation:
[
QD = \frac{Q3 – Q1}{2} = \frac{16 – 6}{2} = 5
]
So, the quartile deviation for this dataset is 5.