What To Know
- Whether you’re a student, researcher, or professional in data science, mastering the fundamentals of statistics gives you a powerful edge.
- A researcher may use a small sample to predict outcomes for an entire population.
Statistics Fundamentals: The Ultimate Comprehensive Guide for Beginners and Researchers
In today’s data-driven world, understanding statistics fundamentals is no longer optional—it’s essential. From business decisions to scientific discoveries, statistics helps us analyze, interpret, and ultimately draw conclusions from data. Whether you’re a student, researcher, or professional in data science, mastering the fundamentals of statistics gives you a powerful edge.
In this extensive guide by ResearchAnalysisHelp.com, we’ll explore everything from basic definitions to advanced applications, combining theoretical understanding with hands-on, real-world examples.
Statistics: The Study of Data and Real-World Insight
At its core, statistics is the study of data—how it is collected, organized, analyzed, and interpreted.
Why Statistics Matters:
- Helps make informed decision-making
- Extracts meaningful insight from raw data points
- Solves complex statistical problems using quantitative and empirical approaches
Statistics combines:
- Mathematics
- Computer science
- Domain knowledge
It is the backbone of modern fields like statistics and data science, machine learning, and analytics.
Statistics Fundamentals: Core Ideas That Drive Data Analysis
The statistics fundamentals revolve around several core ideas that form the foundation of all statistical analyses:
- Data collection through sampling
- Organizing data sets for clarity
- Applying statistical techniques
- Interpreting results to draw conclusions
These foundational principles guide how researchers work with real-world data.
Key Insight:
Without understanding these fundamentals, even advanced tools and statistical software become ineffective.
Introduction to Statistics: Types, Scope, and Importance
An introduction to statistics begins with understanding its two primary branches:
1. Descriptive Statistics
2. Inferential Statistics
Together, they enable researchers to:
- Summarize data
- Make predictions
- Test hypotheses
Statistics is widely used in different fields such as:
- Healthcare
- Finance
- Marketing
- Social sciences
Analyses: Turning Raw Data into Meaningful Patterns
Statistical analyses involve examining a dataset to uncover patterns, relationships, and trends.
Types of Analyses:
- Exploratory data analysis (EDA)
- Regression analysis
- Predictive modeling
Example:
A company analyzing customer purchases might:
- Identify buying patterns
- Forecast demand
- Improve marketing strategies
Key Outcome:
The goal is to interpret data and generate actionable insight.
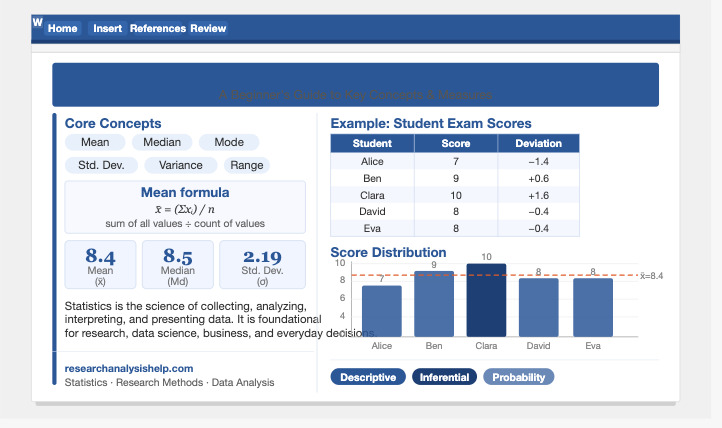
Descriptive Statistics: Summarizing and Representing Data
Descriptive statistics focuses on organizing and summarizing sample data.
Key Measures:
Measures of Central Tendency:
- Mean
- Median
- Mode
Measures of Dispersion:
- Variance
- Standard deviation
- Dispersion
Visualization Tools:
- Histogram
- Charts and graphs
- Tables for representation of data
Example:
A histogram shows how exam scores are distributed across students.
Importance:
- Provides a clear graphical and numerical summary
- Helps identify patterns and variability
Inferential Statistics: Making Predictions and Drawing Conclusions
Inferential statistics allows researchers to make generalizations about a population based on sample data.
Key Techniques:
- Hypothesis testing
- Statistical inference
- Constructing confidence intervals
Example:
A researcher may use a small sample to predict outcomes for an entire population.
Key Concepts:
- Null hypothesis
- Estimation
- Inference
Data Science: The Modern Application of Statistics
Data science integrates statistics and data, programming, and domain expertise.
Applications:
- Machine learning
- Predictive forecasting
- Handling big data
Tools:
- Python (NumPy, Pandas)
- R
- Excel
Insight:
Statistics provides the logic behind prediction and pattern recognition in modern analytics.
Representation of Data: Making Data Understandable
The representation of data is essential for communicating results effectively.
Methods:
- Graphical charts
- Tables
- Visual dashboards
Why It Matters:
- Simplifies complex data
- Makes patterns visible
- Improves understanding in real-world examples
Probability: Measuring Uncertainty
Probability is a core part of statistics used to measure uncertainty.
Key Concepts:
- Random variables
- Binomial distribution
- Likelihood of events
Example:
Predicting the probability of a customer making a purchase.
Sampling: Working Efficiently with Data
Sampling involves selecting a subset of a population.
Types:
- Random sampling
- Stratified sampling
Importance:
- Reduces cost and effort
- Enables statistical inference
Regression and Regression Analysis: Modeling Relationships
Regression is used to analyze relationships between variables.
Example:
Predicting sales based on advertising spend.
Types:
- Linear regression
- Multiple regression
Role:
- Helps in prediction
- Identifies relationships between variables
Variability and Distribution: Understanding Data Behavior
Variability:
Measures how spread out the data is.
- Standard deviation
- Variance
Distribution:
Describes how values are spread.
- Normal distribution
- Skewed distribution
Insight:
Understanding distribution is key to selecting the right statistical tests.
Hypothesis Testing: Validating Assumptions
Hypothesis testing is used to evaluate assumptions about data.
Steps:
- Define null hypothesis
- Perform a statistical test
- Interpret results
Common Tests:
- t-test
- Chi-square test
Statistical Principles: The Theory Behind the Practice
Some important statistical principles include:
- Central limit theorem
- Estimation techniques
- Monte Carlo method
These principles help solve complex statistical problems.
Statistics and Data Science: Real-World Impact
Statistics is widely applied in:
- Healthcare (clinical trials)
- Finance (risk assessment)
- Marketing (customer behavior analysis)
- Technology (machine learning)
Statistical Skills: What You Need to Succeed
To excel in statistics, you need:
- Understanding of statistical concepts and techniques
- Ability to analyze and interpret data
- Knowledge of tools like statistical software
Real-World Examples of Statistics
Example 1:
Using descriptive statistics to analyze exam scores
Example 2:
Applying regression analysis to predict business growth
Example 3:
Using hypothesis testing in medical research
Common Statistical Questions
What are statistics fundamentals?
They are the core ideas that guide how data is collected, analyzed, and interpreted.
Why is statistics important?
It helps us draw conclusions from data and make informed decisions.
What is exploratory data analysis?
It is the process of examining data to uncover patterns and trends.
How is statistics used in data science?
It forms the foundation of machine learning, prediction, and analytics.
Master Statistics with Confidence! 📊
Enhance your understanding of statistics with expert guidance from ResearchAnalysisHelp.com. Start mastering the fundamentals today to elevate your research skills.
Here are relevant assignments you can use for coursework, projects, or practice related to statistics fundamentals:
1. Introduction to Statistics Assignment
Task:
Write a detailed report on the introduction to statistics and explain why statistics is the study of data.
Requirements:
- Define:
- Statistics fundamentals
- Difference between qualitative and quantitative data
- Explain the role of statistics and data science
- Include real-world examples from business or social sciences
2. Descriptive Statistics Assignment
Task:
Perform descriptive statistics on a given dataset.
Steps:
- Calculate:
- Mean, median, mode (measures of central tendency)
- Variance and standard deviation
- Create:
- A histogram
- Tables for representation of data
Goal:
Summarize and interpret the data effectively.
3. Inferential Statistics and Hypothesis Testing Assignment
Task:
Conduct a hypothesis testing exercise using sample data.
Steps:
- Define:
- Null hypothesis
- Perform:
- A statistical test (e.g., t-test or chi-square)
- Draw conclusions using statistical inference
4. Exploratory Data Analysis (EDA) Assignment
Task:
Perform exploratory data analysis on a dataset.
Include:
- Visualization:
- Graphs and charts
- Identify:
- Patterns
- Outliers
- Interpret findings
Goal:
Gain insights before performing deeper analyses.
5. Regression Analysis Assignment
Task:
Perform a regression analysis to study relationships between variables.
Steps:
- Identify:
- Independent and dependent variables
- Build a regression model
- Interpret results
Application:
- Use for prediction and forecasting
6. Probability and Distribution Assignment
Task:
Explain the concept of probability and different types of distribution.
Include:
- Normal distribution
- Binomial distribution
- Examples of random variables
7. Sampling Techniques Assignment
Task:
Design a sampling strategy for a research study.
Requirements:
- Define:
- Population
- Sample
- Explain types of sampling methods
- Justify your approach
8. Data Science and Machine Learning Assignment
Task:
Explain how statistics fundamentals support data science and machine learning.
Include:
- Role of statistics in:
- Model building
- Prediction
- Use of big data
9. Statistical Software Assignment
Task:
Use statistical software (e.g., SPSS, Excel, Python) to analyze data.
Steps:
- Input a dataset
- Perform:
- Descriptive statistics
- Regression analysis
- Interpret results
10. Real-World Statistical Problem Assignment
Task:
Solve a real-world statistical problem using statistical techniques.
Example Topics:
- Market research
- Healthcare data
- Customer behavior
Goal:
Apply statistical concepts and techniques to practical situations.
Final Tip
These assignments will help you:
- Master statistics fundamentals
- Understand statistical analyses
- Build strong statistical skills for research and data science
Final Thoughts
Mastering statistics fundamentals is essential for working with statistics and data effectively. From descriptive statistics to inferential statistics, these tools help you:
- Analyze data sets
- Generate meaningful insight
- Make informed decisions
Key Takeaways:
- Statistics is the foundation of data science
- It combines mathematics, logic, and real-world applications
- Strong statistical skills enable better analysis and prediction
Need Expert Help with Statistics?
At ResearchAnalysisHelp.com, we provide:
- ✔️ Step-by-step guidance on statistical analysis
- ✔️ Help with assignments, projects, and research
- ✔️ Hands-on support with real datasets and tools
👉 Visit ResearchAnalysisHelp.com today and master statistics with confidence!
Here are clear, expert-crafted FAQ answers—written in a mix of concise points and explanatory prose—aligned with the practical, student-focused approach of ResearchAnalysisHelp.com:
FAQs:
What are the fundamentals of basic statistics?
The fundamentals of basic statistics are the core concepts that help you understand, analyze, and interpret data effectively.
Key Fundamentals Include:
- Data collection and sampling – gathering reliable data
- Descriptive statistics – summarizing data using mean, median, and standard deviation
- Probability – understanding uncertainty and likelihood
- Inferential statistics – making predictions and generalizations
- Hypothesis testing – evaluating assumptions using statistical methods
- Data visualization – representing information through graphs and charts
In Simple Terms:
Statistics fundamentals are about learning how to:
- Organize data
- Analyze patterns
- Draw meaningful conclusions
At ResearchAnalysisHelp.com, we simplify these fundamentals so students can confidently apply them in assignments, research, and real-world scenarios.
What are the 7 steps of a statistical study?
A statistical study follows a structured process to ensure accurate and meaningful results.
The 7 Key Steps:
- Define the research problem
- Collect data (using appropriate sampling methods)
- Organize the dataset
- Analyze the data using statistical techniques
- Interpret the results
- Draw conclusions
- Communicate findings
Why These Steps Matter:
Each step builds on the previous one, ensuring:
- Accuracy
- Reliability
- Valid conclusions
At ResearchAnalysisHelp.com, we guide students through each step with practical examples and hands-on support.
What are the four types of statistics?
Statistics is generally divided into four main types, each serving a different purpose.
1. Descriptive Statistics
- Summarizes data
- Uses measures like mean, variance, and standard deviation
2. Inferential Statistics
- Makes predictions about a population
- Uses hypothesis testing and confidence intervals
3. Predictive Statistics
- Focuses on forecasting future outcomes
- Uses regression and modeling
4. Prescriptive Statistics
- Suggests actions based on data insights
- Common in business analytics and decision-making
Key Insight:
Each type helps transform raw data into actionable knowledge. At ResearchAnalysisHelp.com, we help you understand when and how to apply each type effectively.
What are the 10 fundamental principles of official statistics?
The 10 fundamental principles of official statistics are internationally recognized guidelines that ensure data quality, transparency, and trust.
Key Principles Include:
- Relevance – data should meet user needs
- Impartiality – statistics must be unbiased
- Accuracy and reliability
- Transparency in methods
- Confidentiality of data sources
- Cost-effectiveness
- Professional standards
- Coordination across agencies
- Use of international standards
- Accessibility for users
Why They Matter:
These principles ensure that statistics:
- Are trustworthy
- Support informed decision-making
- Maintain public confidence
At ResearchAnalysisHelp.com, we emphasize these principles to help students produce high-quality, ethical, and credible statistical work.
Need Expert Help?
If you’re struggling with statistics fundamentals, assignments, or data analysis:
👉 ResearchAnalysisHelp.com offers:
- ✔️ Step-by-step guidance
- ✔️ Assignment and research support
- ✔️ Clear explanations tailored to your level
Get expert help today and build confidence in statistics!