What To Know
- Understanding how to read a z value table is a fundamental skill in statistics.
- A z-score (also called a standard score) tells you how far an observed value is from the population mean, measured in units of standard deviation (σ).
How to Read Z Value Table: A Complete Step-by-Step Guide for Beginners and Researchers
Understanding how to read a z value table is a fundamental skill in statistics. Whether you’re working with exam scores, research data, or probability-based analysis, the z-table helps you interpret where your data lies within a standard normal distribution.
In this detailed guide by ResearchAnalysisHelp.com, we’ll walk you through everything—from the z-score formula to interpreting z-values, with clear examples and real-world applications.
Z-Score: The Foundation of Understanding Data Position
A z-score (also called a standard score) tells you how far an observed value is from the population mean, measured in units of standard deviation (σ).
Z-Score Formula:
[
z = \frac{X – \mu}{\sigma}
]
Where:
- X = observed value
- μ (population mean)
- σ (population standard deviation)
Key Insight:
- A z-score shows how many standard deviations a value is from the mean
- If the z-score is positive, the value is above the mean
- If the z-score is negative, the value is below the mean
Example:
If a SAT score is 1150, with:
- Mean = 1000
- σ = 100
[
z = \frac{1150 – 1000}{100} = 1.5
]
This means the score is 1.5 standard deviations above the mean.
Probability: What the Z-Table Helps You Find
The main purpose of a z-table is to determine probability.
- It is used to find the probability that a value falls below a certain z-score
- It shows the percentage of values under the normal curve
Key Concept:
- Most z-tables show the area to the left of z
- This area represents the probability or percentage
Z-Table: Your Statistical Lookup Tool
A z-table (or z-score table) is based on the distribution function of a standard normal.
What It Represents:
- A standard normal distribution with:
- Mean of zero (mean is 0)
- Standard deviation is 1
- Values are calculated using the cumulative distribution function
Z-Scores and Z-Values: Understanding Variations
Different z-scores correspond to different probabilities.
Examples:
- z = 1.0 → ~84.13%
- z = 1.2 → ~88.49%
- z = 1.25 → ~89.44%
- z = 3.2 → almost 100%
Each of these z-values helps determine how extreme a value is within a normally distributed dataset.
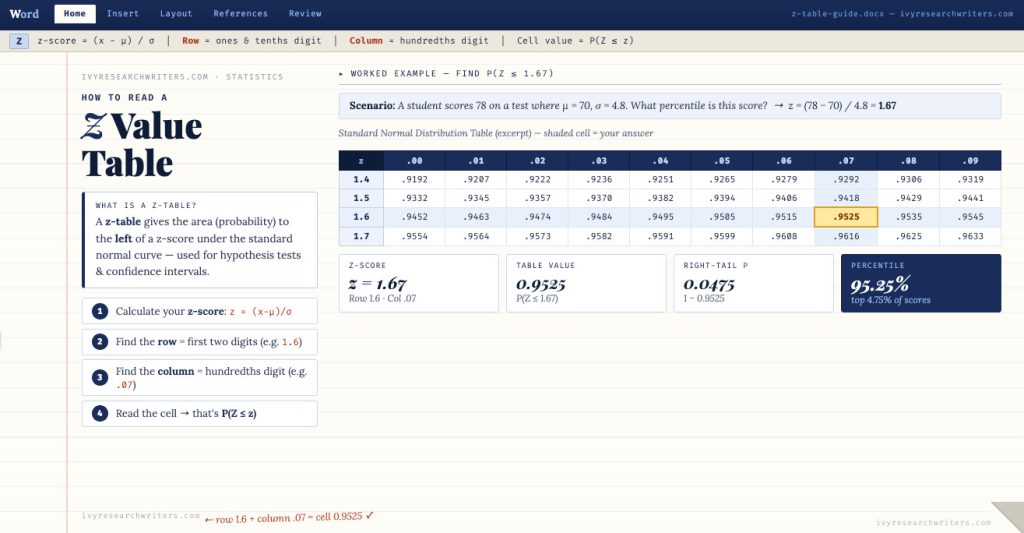
Z Table Structure: How Rows and Columns Work
The z table is organized using:
- Top row of the z-table → second decimal place
- Column of the z-table → whole number + first digit after the decimal
Example:
For z = 1.25:
- Row = 1.2
- Column = 0.05
- Value = 0.8944
👉 This means 89.44% of values are less than 1.25
Standard Normal Distribution: The Bell Curve Explained
The standard normal distribution is a special distribution with:
- Mean = 0 (mean of zero)
- Standard deviation of one
Features:
- Symmetrical bell curve
- Extends from negative infinity to positive infinity
Standard Deviation: Measuring Spread
The standard deviation (σ) indicates how spread out data is.
- Larger σ → wider spread
- Smaller σ → tighter clustering
In a standard normal:
- σ = 1
Distribution and Normal Distributions
A distribution shows how data points are spread.
In Normal Distributions:
- Data follows a bell curve
- Most values lie near the mean
- Few values are extreme
Z-Score Table: Interpreting Values Correctly
A z-score table shows the cumulative probability.
Example:
Given z = 1.25:
- Probability = 0.8944
👉 Interpretation:
- 89.44% of values are to the left of z
Percentile: Understanding Data Position
A percentile tells you the percentage of values below a point.
Example:
- z = 1.28 → 90th percentile
- Meaning the value is higher than 90% of data
Calculating a Z-Score: Step-by-Step
- Take the observed value
- Subtract the population mean
- Divide by standard deviation
Use the Z-Table: Step-by-Step Guide
To use the z-table:
- Round the z-score to two decimal places
- Locate:
- Whole number + first digit after the decimal → row
- Digit after the decimal point → column
- Read the intersection value
Z-Score Formula in Action
[
z = \frac{X – \mu}{\sigma}
]
This formula standardizes values across datasets.
Z Score Interpretation
- z = 0.00 → value is equal to the mean
- z > 0 → above mean
- z < 0 → below mean
Graph: Visualizing the Normal Curve
The graph of a normal curve helps visualize probabilities.
- Center = mean
- Left side = lower values
- Right side = higher values
Z-Tables: Positive and Negative Values
There are:
- Positive z-score table (positive z-table)
- Negative z-score table (negative z-table)
Tip:
If using only a positive z-table:
- For negative z → subtract from 1
P-Value: Linking Z-Scores to Hypothesis Testing
A p-value represents the probability of observing results.
Example:
- z = 1.96 → p ≈ 0.05
Used in:
- Hypothesis testing
- Decision-making
Population Mean and Standard Deviation
- Population mean (μ) = center
- Population standard deviation (σ) = spread
Z-Values and Real Applications
Example:
SAT score = 1150
- Convert to z-score
- Use z-table to determine percentile
Step-by-Step Example
Given Z-Score:
z = 1.25
- Row = 1.2
- Column = 0.05
- Value = 0.8944
👉 Interpretation:
- 89.44% of values are below this score
Negative Z-Score Example
z = -1.25
[
P(Z < -1.25) = 1 – 0.8944 = 0.1056
]
👉 Only 10.56% of values are below
Advanced Insight: Area and Probability
- Z-table shows area to the left
- To find right side:
[
1 – \text{value}
]
Using Technology for Z-Scores
Modern tools like:
- NumPy
- Pandas (panda)
Use the cumulative distribution function to calculate probabilities automatically.
Get Expert Help with Z-Tables, Z-Scores & Statistical Analysis
Still confused about how to read a z value table, interpret a z-score in a standard normal, or calculate accurate probability values?
Here are relevant assignments you can use for coursework, practice, or academic projects related to how to read a z value table:
1. Understanding Z-Scores and the Z-Table Assignment
Task:
Explain the concept of a z-score and how it is used in a standard normal distribution.
Requirements:
- Define:
- z-score (standard score)
- population mean and standard deviation (σ)
- Explain how a z-score shows how far a value is from the mean
- Describe how values can be:
- positive z-score
- negative z-score
Goal:
Build a strong foundation for interpreting z-values and normal distributions.
2. Calculating a Z-Score Assignment
Task:
Practice calculating a z-score using the z-score formula.
Steps:
- Use:
[
z = \frac{X – \mu}{\sigma}
] - Calculate z-scores for multiple data points
- Interpret whether each value is:
- Above or below the mean
- How many standard deviations away
Example:
- Use real data such as SAT score (1150)
3. Reading a Z-Table Assignment
Task:
Learn how to use the z-table to find probabilities.
Steps:
- Identify:
- Whole number + first digit after the decimal
- Digit after the decimal point
- Use:
- Top row of the z-table
- Column of the z-table
- Find the area to the left
Goal:
Correctly find probabilities and interpret results.
4. Probability and Area Under the Curve Assignment
Task:
Use a z-score table to calculate probability.
Requirements:
- Determine:
- Percentage of values below a given z-score
- Calculate:
- Left-tail probability
- Right-tail probability (use subtract)
Focus:
- Understanding area under the normal curve
- Interpreting probability or percentage
5. Positive and Negative Z-Score Assignment
Task:
Compare positive z-score table and negative z-score table results.
Include:
- Interpretation of:
- z-score is positive
- z-score is negative
- Use symmetry to:
- Calculate probabilities
- Find the area
6. Percentile and Z-Score Assignment
Task:
Determine percentiles using z-tables.
Steps:
- Convert z-score to percentile
- Identify values like:
- 90th percentile
- Interpret results
7. Graphing the Normal Distribution Assignment
Task:
Draw a graph (bell curve) of the standard normal distribution.
Include:
- Label:
- Mean = 0
- Standard deviations (±1, ±2, ±3)
- Shade:
- Area to the left of z
- Mark:
- A certain z-score
8. P-Value and Hypothesis Testing Assignment
Task:
Use z-values to calculate a p-value.
Steps:
- Find probability using z-table
- Interpret results in context of hypothesis testing
Goal:
Understand how z-scores are used to determine statistical significance.
9. Real-Life Application Assignment
Task:
Apply z-score analysis to real-world data.
Example Topics:
- SAT score analysis
- Student performance comparison
Requirements:
- Calculate z-score
- Use z-table
- Interpret percentile
10. Z-Table Using Technology Assignment
Task:
Use software tools to compute z-scores and probabilities.
Tools:
- NumPy
- Pandas (panda)
- Excel
Steps:
- Use built-in functions for:
- Cumulative distribution function
- Compare with manual z-table results
Final Tip
These assignments will help you:
- Master how to read a z value table
- Understand probability and normal distributions
- Accurately interpret z-scores and percentiles
Final Thoughts
Mastering how to read a z value table is essential for:
- Understanding probability
- Interpreting data points
- Performing statistical analysis
Key Takeaways:
- Z-score = distance from mean
- Z-table = probabilities based on area under curve
- Helps find probabilities, percentiles, and p-values
Need Help with Statistics?
At ResearchAnalysisHelp.com, we help you:
- ✔️ Understand z-scores and distributions
- ✔️ Solve assignments step-by-step
- ✔️ Use tools like NumPy and Pandas
👉 Visit ResearchAnalysisHelp.com and master statistics with confidence!
FAQs
How do I read a z-value table?
Reading a z-table becomes simple once you understand how a z-score in a standard normal distribution works.
Step-by-step:
- Start with a given z-score in a standard normal distribution
- Break it into:
- Whole number + first decimal → row
- Second decimal (e.g., 0.09) → column
- Locate the intersection in the table
What the Value Means:
- The number you find represents the percentage or probability of values scored less than that z-score
- It shows the area within a particular section of the normal distribution with a mean of 0 and a standard deviation of 1
Example:
- z = 1.09
- Row = 1.0
- Column = 0.09
- Result ≈ 0.8621
👉 This means 86.21% of values scored less than this point.
At ResearchAnalysisHelp.com, we simplify how to interpret a z-score so you can confidently analyze your data.
What is 0.95 in z table?
A value of 0.95 in a z-table represents a percentage or probability.
Meaning:
- It means 95% of values fall below a certain z-score
- This corresponds roughly to a z-score of 1.645
Interpretation:
- The value helps you find the percentage of data points below a specific threshold
- It is commonly used in confidence levels and statistical analysis
Key Insight:
In a standard normal distribution (mean = 0 and the standard deviation = 1), this value helps determine how far a data point lies from the mean.
How do you interpret z-test results?
To interpret a z-score or z-test result:
Key Points:
- A z-score denotes how many standard deviations below the mean or above the mean a value lies
- Positive z → above mean
- Negative z → below mean
Interpretation Process:
- Use the z-table to find the percentage or probability
- Compare it to your significance level
- Determine whether results are statistically meaningful
Example:
- If z = -1.5 → value lies standard deviations below the mean
- Use the table to see how many values scored less
At ResearchAnalysisHelp.com, we help you go beyond numbers and clearly interpret what your z-test results mean in real research contexts.
What is the significance level of 0.05 in Z table?
The significance level of 0.05 is one of the most important thresholds in statistics.
What It Means:
- It represents a 5% probability of error
- Indicates the chance of rejecting a true hypothesis
In Z-Table Context:
- You look for values corresponding to 0.95 (1 – 0.05)
- This helps determine critical z-values
Key Insight:
- If your result falls beyond this threshold, it is considered statistically significant
- It helps define results within a particular confidence range
Why It Matters:
- It ensures your findings are not due to random chance
- Widely used in hypothesis testing across disciplines
Need Expert Help?
Still unsure how to interpret a z-score or use a z-table effectively?
At ResearchAnalysisHelp.com, we provide:
- ✔️ Step-by-step statistical guidance
- ✔️ Clear explanations for z-tests and probabilities
- ✔️ Help with assignments, research, and data interpretation
👉 Get expert support today and make statistics simple and accurate!
