What To Know
- A statistical test is a formal procedure used in statistical analysis to evaluate a hypothesis about a dataset.
- A statistical test used depends on whether your data is categorical, continuous, or ordinal.
Types of Statistical Tests: A Complete Guide for Researchers
Understanding the types of statistical tests is essential for anyone conducting research, whether in academia, business, healthcare, or social sciences. Selecting the appropriate statistical test depends on your type of data, research objectives, and the hypothesis you aim to test.
In this comprehensive guide by ResearchAnalysisHelp.com, we explore various types of statistical tests, their definitions, examples, and how to make the choice of statistical test effectively.
Statistical Test
A statistical test is a formal procedure used in statistical analysis to evaluate a hypothesis about a dataset.
Key Purpose:
- To test the hypothesis
- To determine statistical significance
- To make inference about a population based on sample data
Example:
Determining whether the difference between two teaching methods affects student performance.
Important Concepts:
- Population mean
- Standard deviation and standard error
- Sample size
- Distribution of the data
A statistical test used depends on whether your data is categorical, continuous, or ordinal.
Regression
Regression is a powerful statistical technique used to examine relationships between independent variables and dependent variables.
Types:
- Linear regression (continuous outcome)
- Logistic regression (categorical outcome)
- Multivariable regression (multiple predictors)
Example:
Predicting sales based on advertising budget and market conditions.
Key Features:
- Builds a regression model
- Uses a predictor to estimate values of the dependent variable
- Helps used to find relationships between two variables or more
Why Use Regression?
- To analyze outcome variables
- To understand variable selection
- To handle multivariable data
Parametric Tests
Parametric tests are statistical tests that rely on assumptions about the distribution of the data, especially the normal distribution.
Key Assumptions:
- Data is normally distributed
- Homogeneity of variance
- Independence of observations
Common Parametric Tests:
- t-test
- ANOVA (analysis of variance)
Example:
Comparing the population mean of two groups
Key Point:
Parametric tests assume certain properties of the data, making them powerful but sensitive to violations such as outliers or skewed data.
T-Test
A t-test is one of the most widely tests commonly used to compare two groups.
Types:
- Independent t-test (unpaired)
- Paired t-test (paired or unpaired depending on design)
Use Case:
- Comparing two population means
- Determining whether whether two groups differ significantly
Example:
Comparing test scores between two classrooms
Requirements:
- Continuous data
- Approximate normality
- Equal standard deviation
Inference
Inference refers to drawing conclusions about a population based on sample data.
Why It Matters:
- Helps determine if results are statistically significant
- Used in nearly all statistical methods
Example:
Using sample survey data to infer trends in a larger population
Statistical Methods
There are many statistical methods used in research, each suited to different scenarios.
Categories:
- Parametric tests
- Nonparametric tests
- Regression models
- Survival analysis
Key Consideration:
The test depends on:
- Type of data
- Sample size
- Research question
Survival Analysis
Survival analysis is a specialized method used to analyze time-to-event data.
Example:
Studying how long patients survive after treatment
Features:
- Handles censored observations made
- Focuses on outcome of interest over time
Nonparametric
Nonparametric approaches are used when data does not meet the assumptions of parametric tests.
Advantages:
- No need for normal distribution
- Suitable for ordinal or skewed data
- Robust to outliers
Nonparametric Tests
Nonparametric tests (or non-parametric tests) are alternatives to parametric tests.
Common Tests Include:
- Chi-square test (for categorical variable relationships)
- Mann-Whitney U test
- Wilcoxon test
- Sign test
- Binomial test
Example:
Testing whether observed frequencies differ from expected frequencies (goodness of fit)
Use Case:
- When data could violate assumptions of normality
- When analyzing categorical or ordinal data
Regression Analysis
Regression analysis is used to model relationships between variables and predict outcomes.
Key Components:
- Independent and dependent variables
- Regression model
- Predictor variables
Applications:
- Forecasting trends
- Understanding values of the dependent variable
- Evaluating data points relationships
Choosing a Statistical
Choosing a statistical test is one of the most critical steps in research.
Factors to Consider:
1. Type of Data
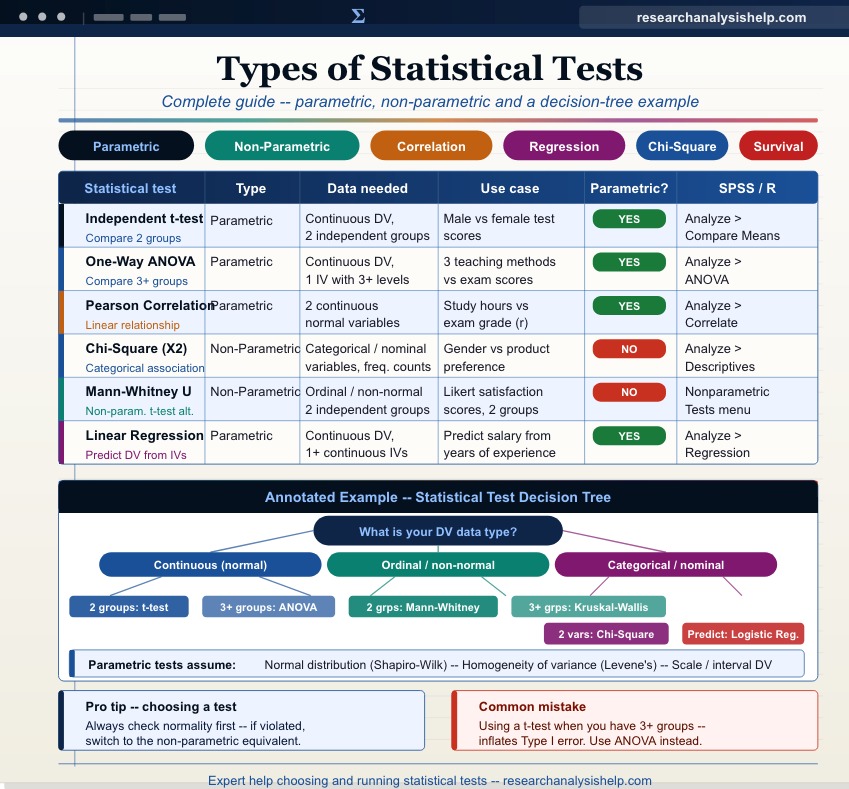
- Categorical variable → Chi-square test
- Continuous variables → t-test or ANOVA
- Ordinal data → Nonparametric tests
2. Number of Groups
- Compare two groups → t-test
- Two or more groups → ANOVA
3. Distribution of the Data
- Normally distributed → Parametric tests
- Non-normal → Nonparametric tests
4. Research Design
- Paired or unpaired samples
- Univariate vs multivariable analysis
5. Hypothesis
- What are you trying to prove?
- Does your test used to determine differences or relationships?
Example:
If your data represent two independent groups with normal distribution → use t-test
If not → choose Mann-Whitney test
Key Insight:
The choice of the test should always be based on the research design, type of data, and assumptions of normality.
Common Statistical Tests Summary
| Test | Data Type | Purpose |
|---|---|---|
| t-test | Continuous | Compare two means |
| ANOVA | Continuous | Compare two or more groups |
| Chi-square test | Categorical | Test relationships |
| Regression | Continuous/Categorical | Predict outcomes |
| Mann-Whitney | Ordinal/Non-normal | Compare two groups |
| Binomial test | Categorical | Compare proportions |
Get Expert Help with Your Statistical Analysis Today
Struggling to understand which statistical tests are used, or how to interpret results like comparing the means and determining whether the observed differences are significant?
Here are relevant assignments you can use for coursework, research practice, or academic submissions related to types of statistical tests:
1. Identifying Types of Statistical Tests Assignment
Task:
Identify and justify the appropriate statistical test used for different research scenarios.
Requirements:
- Define the hypothesis for each case
- Identify:
- Type of data (categorical, ordinal, continuous variables)
- Independent and dependent variables
- Choose among:
- t-test, ANOVA, chi-square test, regression, or nonparametric tests
Goal:
Demonstrate how the choice of statistical test depends on the data distribution and research design.
2. Parametric vs Nonparametric Tests Assignment
Task:
Compare parametric tests and nonparametric tests.
Include:
- Assumptions:
- Normal distribution
- Homogeneity of variance
- Examples:
- Parametric: t-test, ANOVA
- Nonparametric: Mann-Whitney, Wilcoxon, chi-square test
Focus:
- When data could violate assumptions
- Impact of outliers and deviation
3. T-Test and ANOVA Assignment
Task:
Perform and interpret a t-test and analysis of variance (ANOVA).
Steps:
- Compare:
- Two population means (t-test)
- Two or more groups (ANOVA)
- Calculate:
- Standard deviation, standard error, and variance
- Interpret:
- Statistical significance
Example:
- Compare student scores across classes (t-test vs ANOVA)
4. Regression Analysis Assignment
Task:
Conduct a regression analysis using real or simulated data.
Requirements:
- Define:
- Predictor (independent variables)
- Outcome variables (dependent variables)
- Build a regression model
- Interpret:
- Coefficients
- Relationship between two variables or more
Extension:
- Include logistic regression for categorical outcomes
5. Chi-Square Test Assignment
Task:
Use the chi-square test to analyze relationships between categorical variables.
Steps:
- Create contingency tables
- Perform goodness of fit or independence test
- Interpret whether observed data differs from expected
6. Survival Analysis Assignment
Task:
Apply survival analysis to time-based data.
Example:
- Time until recovery after treatment
Focus:
- Handling censored observations made
- Interpreting survival curves
7. Choosing a Statistical Test Assignment
Task:
Develop a decision guide for choosing a statistical method.
Include:
- Decision tree based on:
- Type of data
- Sample size
- Distribution of the data
- Explain how each test depends on assumptions like normality
Goal:
Help researchers choose the right statistical test effectively.
8. Hypothesis Testing Assignment
Task:
Perform full statistical analysis to test the hypothesis.
Steps:
- Define:
- Null and alternative hypotheses
- Select the statistical test used
- Calculate results
- Interpret whether findings are statistically significant
9. SPSS-Based Statistical Tests Assignment
Task:
Use SPSS to run multiple statistical methods.
Include:
- t-test
- ANOVA
- Regression analysis
- Nonparametric tests
Deliverables:
- Output interpretation
- Explanation of results
10. Univariate vs Multivariable Analysis Assignment
Task:
Compare univariate and multivariable approaches.
Focus:
- Single variable vs multiple predictors
- Role of variable selection
- Impact on outcome of interest
Final Tip
These assignments will help you master:
- Various statistical techniques
- How to compare two or more groups
- How to interpret values of the dependent variable
- How to ensure your results are statistically valid
Final Thoughts
Understanding the types of statistical tests is crucial for accurate statistical analysis and valid conclusions. Each test differs based on its assumptions, purpose, and data requirements.
Key Takeaways:
- Always define your hypothesis
- Identify your types of variables
- Check the data distribution
- Ensure the appropriate statistical method is used
Choosing the wrong test can lead to misleading results, while the right choice strengthens your research credibility.
Need Help Choosing the Right Test?
At ResearchAnalysisHelp.com, we simplify complex statistical methods and help you:
- ✔️ Select the appropriate statistical test
- ✔️ Perform analysis using SPSS
- ✔️ Interpret results with confidence
- ✔️ Ensure your findings are statistically significant
👉 Get expert guidance today and elevate your research with precision!
FAQs:
Here are clear, expert-backed FAQ answers—crafted in a mix of concise points and explanatory prose—aligned with ResearchAnalysisHelp.com’s academic expertise:
What are the five statistical tests?
There are many statistical tools available, but five of the most commonly used tests are:
- t-test – used for comparing the means of two groups
- ANOVA (Analysis of Variance) – extends comparison to three or more groups
- Chi-square test – analyzes relationships between categorical data
- Regression analysis – examines relationships between variables
- Mann-Whitney U test – a nonparametric alternative for comparing two groups
These tests are used across disciplines because they help researchers evaluate data and determine whether the observed results are meaningful or due to chance. At ResearchAnalysisHelp.com, we guide you in selecting the right test depending on your dataset and research objective.
What are types of statistical tests?
The types of statistical tests can be broadly categorized based on data characteristics and assumptions:
1. Parametric Tests
- Examples: t-test, ANOVA
- Used when data is normally distributed
2. Nonparametric Tests
- Examples: Mann-Whitney, Wilcoxon
- Used when data does not meet parametric assumptions
3. Correlation and Regression Tests
- Used to analyze relationships between variables
4. Categorical Data Tests
- Example: Chi-square test
These tests are used in different research contexts depending on the type of data and research design. Choosing the right category helps you choose among multiple statistical options and ensures valid conclusions.
What are the 7 types of statistical analysis?
The seven major types of statistical analysis include:
- Descriptive analysis – summarizes data using measures like mean and percentage
- Inferential analysis – draws conclusions about populations
- Regression analysis – predicts outcomes
- Hypothesis testing – evaluates assumptions
- ANOVA analysis – compares multiple group means
- Time-series analysis – analyzes data over time
- Survival analysis – studies time-to-event data
These approaches are essential because statistical tests make it possible to interpret raw data meaningfully. At ResearchAnalysisHelp.com, we help students apply these analyses effectively across academic and professional research.
Which is better, ANOVA or t-test?
The answer depends on your research needs—neither is universally “better.”
Use a t-test when:
- You are comparing the means of two groups
Use ANOVA when:
- You are comparing three or more groups
Key Insight:
- A t-test is simpler and ideal for small comparisons
- ANOVA is more flexible and prevents error when analyzing multiple groups
Both tests are used to determine whether the observed differences are statistically significant. The right choice depends on your data structure, and selecting correctly helps you choose among appropriate statistical methods.
At ResearchAnalysisHelp.com, we ensure you not only pick the right test but also interpret your results accurately for maximum academic impact.
Need Expert Guidance?
If you’re unsure which test to use or how to interpret results, ResearchAnalysisHelp.com offers:
- ✔️ Personalized statistical support
- ✔️ SPSS, R, and Excel guidance
- ✔️ Assignment and research help
👉 Get expert assistance today and make your statistical analysis simple and accurate!