What To Know
- An independent samples t-test showed a significant difference between Group A and Group B, p <.
- In today’s research and business landscape, SPSS data analysis is one of the most trusted methods for handling complex data and generating reliable, data-driven results.
Short Step-by-Step Tutorial of SPSS Data Analysis
1. Open SPSS and load your data
Start IBM SPSS Statistics and open your dataset.
- Go to File > Open > Data
- Select your SPSS, Excel, or CSV file
- Your data will appear in Data View
2. Check Variable View
Click Variable View at the bottom to define your variables.
- Add variable names
- Choose the correct type, such as numeric or string
- Add value labels where needed
- Set missing values if applicable
This step helps keep your SPSS data organized before analysis.
3. Clean and prepare the data
Review the dataset for errors before you analyze anything.
- Look for blank cells or missing data
- Make sure categories are coded correctly
- Check whether variables need to be recoded or grouped
Good data preparation improves the accuracy of your results.
4. Run descriptive statistics
Start with a simple summary of the data.
- Click Analyze > Descriptive Statistics
- Choose Frequencies, Descriptives, or Explore
- Move your variables into the analysis box
- Click OK
This gives you basic results such as mean, frequency, and standard deviation.
5. Choose the right statistical test
Select your test based on your research question.
- Use Independent Samples T-Test for comparing two groups
- Use ANOVA for comparing three or more groups
- Use Correlation to check relationships
- Use Linear Regression or Logistic Regression for prediction
Go to Analyze and choose the relevant test.
6. Review the SPSS output
SPSS will open an Output Viewer with tables and charts.
Focus on:
- Descriptive summaries
- Significance value, often called p-value
- Coefficients, group means, or test statistics
This is where you interpret your findings.
7. Create charts if needed
To visualize your data:
- Go to Graphs > Chart Builder
- Choose a bar chart, histogram, boxplot, or scatterplot
- Add variables and click OK
This helps present results more clearly.
8. Interpret and report the results
Write your findings in simple language.
Example:
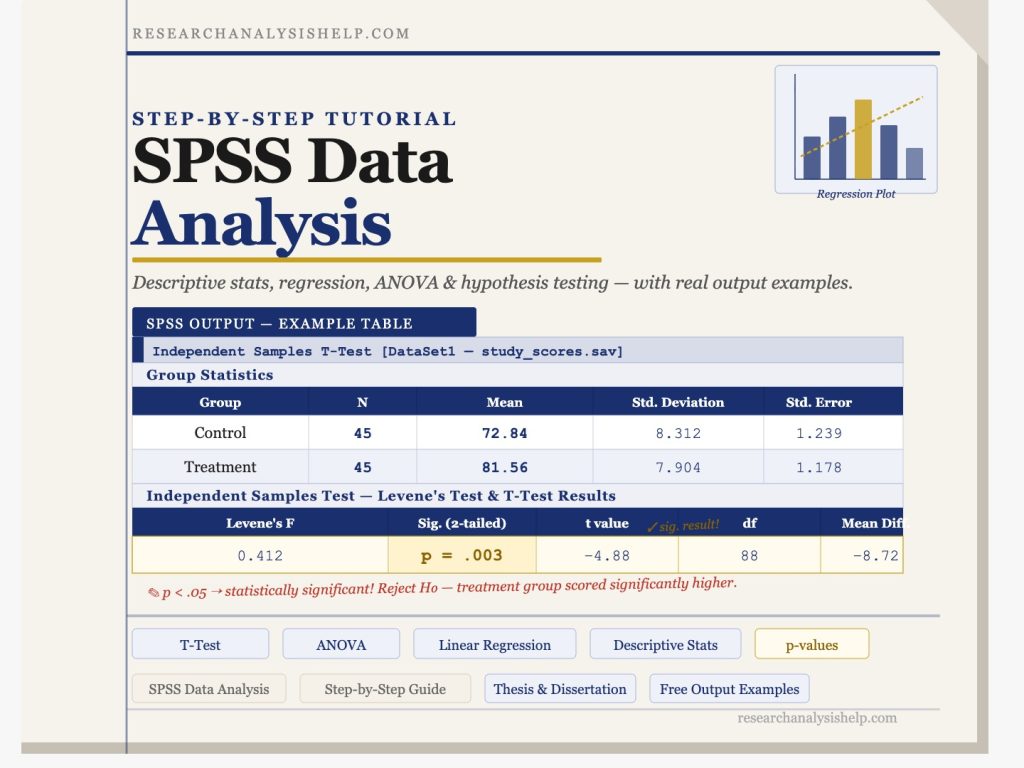
An independent samples t-test showed a significant difference between Group A and Group B, p < .05.
Your final report should explain:
- What test you used
- Why you used it
- What the result means
9. Save your work
Save both the dataset and output.
- File > Save As for data
- File > Save for SPSS output
That way, you can return to your analysis later.
Quick Example
If you want to compare male and female exam scores:
- Load the dataset
- Check that gender is coded correctly
- Go to Analyze > Compare Means > Independent-Samples T-Test
- Put exam score as the test variable
- Put gender as the grouping variable
- Click OK and interpret the output
Final Tip
Always begin with descriptive statistics before moving to advanced tests. That makes SPSS data analysis easier, cleaner, and more reliable.
SPSS Data Analysis Services: Expert Statistical Solutions for Accurate Insights
In today’s research and business landscape, SPSS data analysis is one of the most trusted methods for handling complex data and generating reliable, data-driven results. At ResearchAnalysisHelp.com, we specialize in delivering professional SPSS data analysis services using IBM SPSS Statistics to help you make smarter decisions and turn complex datasets into actionable insights.
Whether you’re working on academic research, market research, or business analytics, our experts use advanced statistical analysis techniques to analyze data, interpret SPSS output, and deliver meaningful conclusions.
SPSS Data Analysis: Transforming Data into Reliable Results
SPSS (Statistical Package for the Social Sciences) is a powerful statistical software program designed to simplify data analysis and provide accurate results. Our SPSS data analysis services focus on:
- Cleaning and organizing SPSS data files
- Performing statistical tests and regression analysis
- Interpreting results using summary statistics
- Creating reports for data-driven decisions
Using SPSS software, we help clients simplify complex data and extract insights from datasets across industries like social research, healthcare, and market research.
IBM SPSS & Statistical Power: Advanced Analytics for Research
IBM SPSS Statistics is a comprehensive platform that combines robust statistical tools with user-friendly features. It is widely used for advanced statistics, predictive modeling, and multivariate analysis.
Key Features of SPSS:
- Easy-to-use interface with custom tables and data visualization
- Ability to read and write multiple data files
- Advanced modeling techniques like decision trees, neural networks, and mixed models
- Support for categorical variables and complex samples
At ResearchAnalysisHelp.com, we leverage IBM® SPSS Statistics to deliver reliable results using best-in-class features and add-on packages.
Statistical Analysis with SPSS: From Basic to Advanced
Our services cover a full range of statistical analysis, from basic data summaries to advanced statistical analysis.
We perform:
- Univariate analysis (mean, variance, frequency)
- Bivariate analysis (correlation, cross-tabulation)
- Multivariate analysis for studying complex relationships
We also handle missing data, apply proper data preparation, and ensure your dataset is ready for accurate analysis.
Regression Analysis: Linear, Logistic & Predictive Modeling
Regression analysis is one of the most powerful techniques in SPSS for understanding relationships between variables.
Linear Regression
Used when predicting a continuous outcome based on independent variables.
Example: Predicting sales based on advertising spend.
Logistic Regression
Used when dealing with categorical or dichotomous outcomes.
Example: Predicting whether a customer will purchase a product (yes/no).
Advanced Predictive Modeling
We also apply:
- Probit models
- Generalized linear models (GENLIN)
- Predictive analytics for forecasting trends
These methods help uncover patterns and support data-driven decisions.
SPSS Data & Data Files: Managing Complex Datasets
Working with SPSS data involves handling structured datasets stored in data files. Our experts ensure:
- Proper data preparation and cleaning
- Accurate labeling using value labels
- Efficient handling of large and complex data
We also assist with importing data from tools like Excel, SAS, Stata, and even open-source platforms for seamless integration.
Statistical Tests: T-Test, ANOVA & More
SPSS provides a wide range of statistical tests to analyze data effectively.
T-Test
Used to compare means between two groups.
- Includes independent samples t-test
- Helps determine if differences are statistically significant
ANOVA (Analysis of Variance)
Used to compare means across multiple groups.
Example: Comparing customer satisfaction across different regions.
These tests are essential for hypothesis testing and ensuring reliable results in research.
Get Professional SPSS Data Analysis Support Today
Skip the hassle of downloading software, figuring out a free trial, or struggling with example data on your own. AtResearchAnalysisHelp.com, our experts handle everything—from data preparation to advanced statistical analysis—so you get accurate, reliable results without the stress.
Multivariate Analysis: Understanding Complex Relationships
When dealing with complex data, multivariate analysis is crucial. It allows researchers to study multiple variables simultaneously.
We offer:
- Principal components analysis
- Cluster analysis for segmentation
- Factor analysis for data reduction
These techniques help uncover hidden patterns and relationships within datasets.
Linear Models & Independent Samples: Accurate Comparisons
SPSS supports a variety of linear models that help analyze relationships between variables.
We specialize in:
- Linear regression for continuous outcomes
- Analysis of independent samples
- Testing variance and group differences
This ensures your research findings are statistically valid and easy to interpret.
SPSS Products & Features: Tools for Smarter Analysis
SPSS products offer a range of tools designed to enhance data analysis capabilities.
Features of SPSS Include:
- Intuitive interface with syntax and SPSS commands
- Advanced data visualization tools
- Integration with analytics platforms
- Continuous enhancement and updates
With IBM SPSS Statistics versions, users can access best-in-class features for both beginner and advanced users.
Using SPSS for Research: Step-by-Step Support
If you’re new and want to learn SPSS, our experts provide step-by-step guidance.
We help you:
- Understand SPSS output
- Perform statistical tests correctly
- Interpret results for academic or business use
Our goal is to help you learn SPSS while delivering professional-grade analysis.
Use Cases: Market Research, Social Research & More
Our SPSS data analysis services are widely used across industries:
- Market research: Analyze customer preferences and trends
- Social research: Study behavior and societal patterns
- Healthcare: Evaluate treatment outcomes
- Business analytics: Improve performance and forecasting
We ensure every project delivers actionable insights and supports data-driven decisions.
See Also: SPSS vs Other Statistical Software
While SPSS is a leading statistical software, other tools like SAS and Stata are also used in analytics. However, SPSS stands out because:
- It is designed to help non-programmers
- Offers a user-friendly interface
- Combines robust statistical methods with ease of use
Unlike many open-source tools, SPSS provides a seamless experience for both beginners and professionals.
Why Choose ResearchAnalysisHelp.com for SPSS Data Analysis?
- Expertise in IBM SPSS Statistics and advanced statistical analysis
- Experience handling complex samples and large datasets
- Accurate interpretation of SPSS output
- Support for academic, business, and research projects
- Focus on delivering reliable results and actionable insights
We don’t just analyze data—we help you turn complex information into clear, meaningful conclusions.
Get Started with Expert SPSS Data Analysis Today
Whether you need help with regression analysis, t-tests, ANOVA, or multivariate analysis, our team is ready to assist.
👉 Contact ResearchAnalysisHelp.com today to get expert support in SPSS data analysis and make smarter, data-driven decisions with confidence.
Here are SEO-friendly FAQ answers tailored for ResearchAnalysisHelp.com, written in a balanced mix of points and explanatory prose:
FAQs
What is SPSS for data analysis?
SPSS (Statistical Package for the Social Sciences) is a powerful statistical software used to analyze, manage, and interpret data. It is widely used in academic research, business analytics, and social sciences.
- It helps users work with example data or real datasets to perform statistical tests
- Supports techniques like regression, ANOVA, and correlation
- Allows researchers to stratify data into groups for deeper analysis
In simple terms, SPSS turns raw numbers into meaningful insights. At ResearchAnalysisHelp.com, we use SPSS to help clients generate accurate results and make data-driven decisions without needing to master the software themselves.
How can I download SPSS for free?
IBM SPSS is a premium software, but there are limited ways to access it for free:
- IBM offers a free trial of SPSS Statistics for a limited period
- Some universities provide students access through institutional licenses
- You can practice using example data during the trial period
However, installing and using SPSS effectively can still be challenging for beginners. That’s why many clients prefer ResearchAnalysisHelp.com—we provide expert SPSS analysis without the need to download, install, or learn the software from scratch.
How do you analyze data in SPSS?
Analyzing data in SPSS involves several structured steps:
- Data Entry & Preparation
Import datasets or use example data, clean missing values, and organize variables - Data Exploration
Use descriptive statistics and charts to understand trends - Stratify Data
Group data into categories (e.g., gender, age groups) to compare results - Apply Statistical Tests
Run tests like t-tests, ANOVA, or regression depending on your research objective - Interpret Results
Review SPSS output tables and graphs to draw conclusions
While the process may sound simple, accurate interpretation requires expertise. At ResearchAnalysisHelp.com, our statisticians ensure each step is performed correctly to deliver reliable insights.
What are the data analysis methods in SPSS?
SPSS supports a wide range of data analysis methods, including:
- Descriptive Statistics
Summarizes data using mean, median, and standard deviation - Inferential Statistics
Includes hypothesis testing using t-tests and ANOVA - Regression Analysis
Predicts relationships between variables - Multivariate Analysis
Examines complex relationships across multiple variables - Data Stratification
Helps stratify datasets into meaningful groups for deeper insights
You can test these methods using example data during a free trial, but applying them correctly requires strong statistical knowledge.
That’s where ResearchAnalysisHelp.com stands out—we don’t just run tests; we ensure the right methods are applied to produce accurate, publication-ready results.