What To Know
- The t-score is a test statistic that helps determine whether there is a statistically significant difference between a sample mean and a population mean, or between the means of two samples.
- The t-score formula takes into account the sample mean, population mean, sample size, and sample standard deviation, making it a robust tool for analyzing data, especially when the sample size is small or the population standard deviation is unknown.
How to Calculate a T-Score: A Comprehensive Guide
In the world of statistical analysis, calculating a t-score is an essential step when performing a t-test. The t-score is a test statistic that helps determine whether there is a statistically significant difference between a sample mean and a population mean, or between the means of two samples. Understanding how to calculate t score is critical for conducting hypothesis testing and making informed decisions based on data.
This blog post will walk you through the process of calculating the t-score, providing examples and definitions where necessary, and explaining its use in various statistical tests.
What is a T-Score?
A t-score is a type of test statistic used in t-tests. It indicates how many standard deviations a data point or sample mean is away from the population mean. The t-score formula takes into account the sample mean, population mean, sample size, and sample standard deviation, making it a robust tool for analyzing data, especially when the sample size is small or the population standard deviation is unknown.
Why is the T-Score Important?
- The t-score allows you to assess whether the difference between the sample mean and the population mean is statistically significant.
- It is essential for conducting tests like one-sample t-tests, two-sample t-tests, and paired t-tests.
- T-scores are typically used when working with small sample sizes (less than 30), where the z-score may not be applicable.
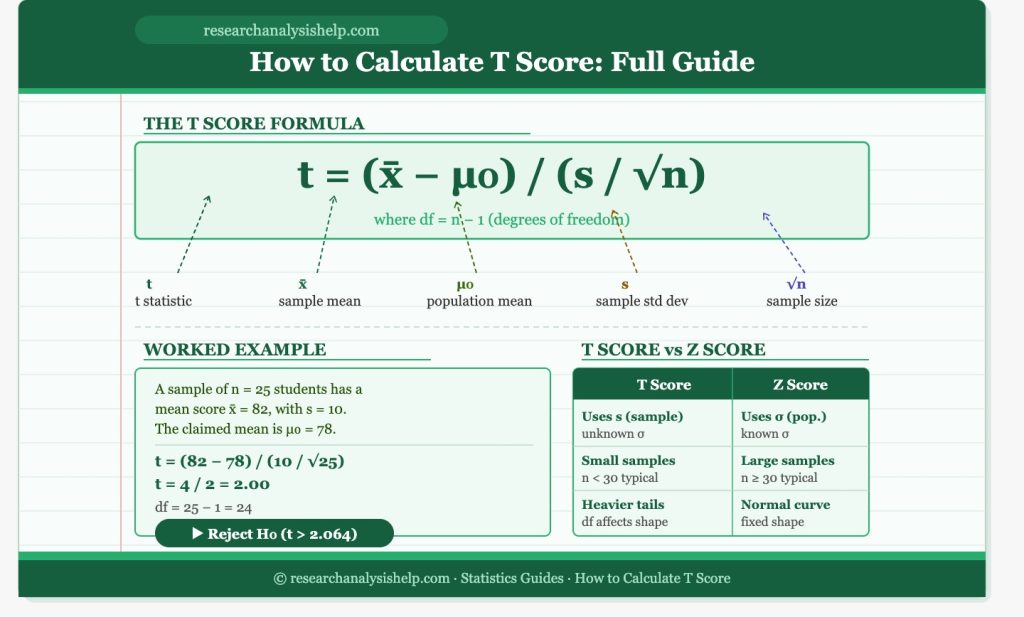
The T-Score Formula
To calculate a t-score, you can use the following formula:
[
t = \frac{\overline{X} – \mu}{\frac{s}{\sqrt{n}}}
]
Where:
- ( \overline{X} ) = sample mean
- ( \mu ) = population mean (or the hypothesized value in a null hypothesis)
- ( s ) = sample standard deviation
- ( n ) = sample size
The t-statistic (or t-value) compares how far the sample mean is from the population mean, measured in terms of the standard error.
Example Calculation:
Suppose you have a sample of 15 students, and you want to test whether their average score on a test differs from the population average of 75. Here’s the information:
- Sample Mean (( \overline{X} )) = 80
- Population Mean (( \mu )) = 75
- Sample Standard Deviation (( s )) = 10
- Sample Size (( n )) = 15
Using the t-score formula:
[
t = \frac{80 – 75}{\frac{10}{\sqrt{15}}} = \frac{5}{2.58} \approx 1.94
]
The t-score is 1.94, which means the sample mean is 1.94 standard deviations away from the population mean.
How to Calculate a T-Score for a T-Test
The t-test is one of the most commonly used statistical tests, and it helps you determine if there is a statistically significant difference between two datasets. Here’s how to calculate a t-score when performing different types of t-tests:
1. One-Sample T-Test:
- Used when you are comparing a sample mean to a known population mean.
- Formula:
[
t = \frac{\overline{X} – \mu}{\frac{s}{\sqrt{n}}}
] - Interpretation: The t-score tells you how far the sample mean is from the population mean in terms of standard error.
2. Two-Sample T-Test:
- Used when you compare the means of two independent samples to see if there is a significant difference between them.
- Formula:
[
t = \frac{\overline{X_1} – \overline{X_2}}{\sqrt{\frac{s_1^2}{n_1} + \frac{s_2^2}{n_2}}}
] - Where:
- ( \overline{X_1} ) and ( \overline{X_2} ) = means of the two samples
- ( s_1^2 ) and ( s_2^2 ) = variances of the two samples
- ( n_1 ) and ( n_2 ) = sample sizes of the two groups
- Interpretation: This t-score tells you how different the means of the two groups are, measured in terms of the standard error of the difference between them.
3. Paired T-Test:
- Used when comparing two related groups or the same group at two different times (e.g., pre- and post-test).
- Formula:
[
t = \frac{\overline{d}}{\frac{s_d}{\sqrt{n}}}
] - Where:
- ( \overline{d} ) = mean of the differences between pairs
- ( s_d ) = standard deviation of the differences
- ( n ) = number of pairs
- Interpretation: The t-score tells you how different the means of the paired differences are, measured in terms of the standard error.
How to Find the T-Critical Value
To interpret your t-score, you need to compare it to the t-critical value obtained from the t-distribution table. The t-critical value depends on:
- Degrees of freedom (df): For a one-sample t-test, df = ( n – 1 ). For a two-sample t-test, df is calculated differently based on the sample sizes.
- Significance level (α): The common α value is 0.05, but it could vary depending on the confidence level (e.g., 0.01 for 99% confidence).
- One-tailed or two-tailed test: A two-tailed test will have critical values on both sides of the distribution, while a one-tailed test will have only one critical value.
Interpreting the T-Score
After calculating the t-statistic, compare it to the t-critical value to determine the result of your hypothesis test:
- If the absolute value of the t-statistic is greater than the t-critical value, you reject the null hypothesis and conclude that there is a significant difference.
- If the absolute value of the t-statistic is less than or equal to the t-critical value, you fail to reject the null hypothesis and conclude that there is no significant difference.
Example:
For a two-tailed test with df = 14 and α = 0.05, the t-critical value is approximately 2.144 (from the t-distribution table). If your calculated t-score is 2.5, then you would reject the null hypothesis, as the t-score exceeds the critical value.
Ready to master t-scores, z-scores, and statistical hypothesis testing?
Whether you’re comparing means, performing t-tests, or analyzing data deviations, Research Analysis Help is here to guide you every step of the way.
Related Assignments for Understanding T-Scores and Z-Scores in Statistical Analysis
These assignments will help you enhance your understanding of statistical analysis, focusing on the use of t-statistics and z-scores, as well as their application in various hypothesis tests. Learn to calculate these values, interpret them, and understand their significance in hypothesis testing.
1. Calculating Z-Scores to Measure Standard Deviations Above the Mean
Assignment: Given a dataset, calculate the z-score for each data point. The z-score measures how many standard deviations a data point is from the mean. Interpret both positive and negative z-scores and explain what they signify regarding how far a data point lies from the mean.
- Goal: Understand how z-scores can be used to determine how far a data point is from the mean and how they relate to the normal distribution.
- Tools: Excel or any statistical calculator.
- Key Terms: Standard deviations above the mean, normal distribution, calculate a z-score.
2. Performing a T-Test to Compare the Difference Between Two Means
Assignment: Use the t-statistic to compare the mean score of two independent groups (e.g., test scores of two different classes). Calculate the t-statistic and determine if the difference between the two means is statistically significant. Report the p-value and conclude whether to support or reject the null hypothesis.
- Goal: Learn how to use a t-test to compare the means of two datasets and interpret the test statistic and p-value.
- Tools: T-distribution table, critical value calculator.
- Key Terms: T-test to compare, t-statistic, difference between the two, reject the null hypothesis, p-value.
3. Analyzing Variability Using ANOVA to Compare More Than Two Means
Assignment: Given data from three or more groups, perform an ANOVA to compare the means of these groups. Calculate the F-statistic, p-value, and interpret whether the differences between the means are statistically significant.
- Goal: Understand how ANOVA (Analysis of Variance) is used to test the differences between more than two groups, and calculate the F-statistic to assess the variability between them.
- Tools: ANOVA calculator, F-distribution table.
- Key Terms: ANOVA, F-statistic, test for differences, means divided.
4. Understanding the Deviation from the Mean: Standard Error and T-Statistic
Assignment: For a given sample, calculate the t-statistic using the formula:
[
t = \frac{\overline{X} – \mu}{\frac{s}{\sqrt{n}}}
]
Use the t-distribution to calculate the critical value and determine whether the observed difference from the mean is statistically significant. Discuss how standard deviations above the mean relate to standard error.
- Goal: Learn to calculate and interpret the t-statistic and understand how deviations from the mean affect hypothesis testing.
- Tools: T-distribution table, critical value calculator.
- Key Terms: T-statistic, standard deviations above the mean, calculate a t-test, standard error.
5. Interpreting Positive and Negative Z-Scores in Hypothesis Testing
Assignment: Given a set of data, calculate the z-scores and analyze how positive and negative z-scores indicate the deviation from the mean. Discuss the significance of z-scores in hypothesis testing, specifically in one-tailed and two-tailed tests.
- Goal: Understand how z-scores are used in hypothesis testing to identify deviations from the mean and evaluate whether the result is statistically significant.
- Tools: Z-table, critical value calculator.
- Key Terms: Z-scores, one-tailed test, two-tailed test, significance level.
6. Using the T-Statistic to Compare Two Data Sets
Assignment: For two datasets, calculate the t-statistic and determine if the difference between the two means is statistically significant. Compare the mean scores of both datasets and use the t-table to determine the critical t-value.
- Goal: Learn to compare two datasets using the t-statistic and evaluate the statistical significance of their mean difference.
- Tools: T-table, critical value calculator.
- Key Terms: T-test to compare, t-statistic, two means, calculate t-test.
7. Using Z-Scores and T-Scores for Comparing Data Points
Assignment: Given a dataset, calculate both the z-scores and t-scores for each data point. Compare the z-scores with the t-scores and discuss their differences in terms of standard deviations and sample size.
- Goal: Understand how z-scores and t-scores differ and when to use each in statistical analysis.
- Tools: Z-distribution table, t-distribution table.
- Key Terms: Z-scores, t-scores, number of standard deviations, standard deviations above the mean.
8. Applying T-Test for Statistical Differences in Small Sample Sizes
Assignment: Given a small dataset, perform a t-test to test for a statistically significant difference in the mean score between the sample and the population. Calculate the t-statistic, compare it with the critical t-value, and determine the p-value to reject or fail to reject the null hypothesis.
- Goal: Apply the t-test for small sample sizes to determine if the difference between the sample and population means is statistically significant.
- Tools: T-distribution table, p-value calculator.
- Key Terms: T-test to compare, test for differences, small sample sizes, statistically significant.
9. Analyzing the Deviation from the Mean Using One or Two Standard Deviations
Assignment: Calculate the t-statistic for a dataset and identify how many standard deviations the sample mean is away from the population mean. Discuss how the deviation from the mean affects hypothesis testing and whether it indicates a statistically significant result.
- Goal: Analyze how deviations from the mean influence the interpretation of hypothesis testing results, particularly in terms of z-scores and t-scores.
- Tools: T-test, critical value calculator.
- Key Terms: Standard deviation, deviations from the mean, two standard deviations, t-statistic.
10. Using a T-Test for One-Sample and Two-Sample Comparisons
Assignment: Perform a t-test to compare the mean score of a sample with a known population mean. Then, use a two-sample t-test to compare the means of two independent samples and discuss the differences in the t-statistic for both tests.
- Goal: Learn to use t-tests to compare sample data with known population values or other sample data.
- Tools: T-distribution table, critical value calculator.
- Key Terms: T-test, mean score, two-sample, test for differences.
These related assignments will help you gain a deeper understanding of t-scores, z-scores, and statistical hypothesis testing. Whether you’re comparing sample means, calculating p values, or analyzing deviations from the mean, these assignments will give you the practice needed to conduct accurate and statistically significant analyses.
If you need expert help with t-tests, z-scores, or any other statistical methods, Research Analysis Help is here to assist!
📧 Contact us today at Research Analysis Help for personalized assistance with your statistical analysis! 📊
Conclusion
The t-score is a crucial test statistic used in t-tests to assess the difference between a sample mean and a population mean, or between the means of two independent samples. By following the t-score formula, you can calculate t-scores for various tests, compare them to critical values, and make informed decisions about whether the data supports the null hypothesis.
At Research Analysis Help, we provide expert assistance with hypothesis testing, t-scores, and data analysis. If you’re unsure about calculating your t-test or interpreting the results, our team of experts can guide you through every step of the process.
📧 Contact us today at Research Analysis Help for personalized support with your statistical analysis and t-test calculations! 📊
Key Points for Understanding T-Scores in Statistics or Data Entry
- The t-score indicates how many standard deviations a data point (or sample mean) is from the population mean.
- A positive t-score indicates that the sample mean is above the population mean, while a negative t-score indicates it is below.
- In hypothesis testing, you reject the null hypothesis if the t-score is greater than the critical t-value (in absolute terms) or falls in the rejection region.
- The critical value is based on the significance level (often ( \alpha = 0.05 )) and determines the cut-off beyond which the difference between the sample and population means is considered statistically significant.
- Use the t-distribution table or critical value calculator to find the appropriate critical value based on your confidence level, sample size, and degrees of freedom.
By calculating and interpreting the t-score, you can assess the statistical significance of your results, compare sample means, and make informed decisions about hypothesis testing.
For more detailed assistance in calculating t-scores, performing t-tests, or interpreting results, Research Analysis Help is here to guide you! Reach out today for expert help in statistical analysis and hypothesis testing.
📧 Contact us now at Research Analysis Help to get started on your statistical analysis journey! 📊
FAQs:
What is the Formula for T-Score?
The t-score is a test statistic used in hypothesis testing, specifically for t-tests. The formula for calculating the t-score is:
[
t = \frac{\overline{X} – \mu}{\frac{s}{\sqrt{n}}}
]
Where:
- ( \overline{X} ) = sample mean
- ( \mu ) = population mean (or hypothesized value in the null hypothesis)
- ( s ) = sample standard deviation
- ( n ) = sample size
This formula measures how far the sample mean is from the population mean in terms of the standard error. The t-score tells you how many standard deviations above or below the mean the sample mean is. It is particularly useful for small sample sizes or when the population standard deviation is unknown, unlike the z-scores which are used when the population standard deviation is known or the sample size is large.
How Do They Calculate T-Score?
To calculate the t-score, follow these steps:
- Determine the sample mean (( \overline{X} )): This is the average of all the data points in your sample.
- Find the population mean (( \mu )): This is either the known population mean or the value you are testing the sample mean against in your hypothesis test.
- Calculate the sample standard deviation (( s )): The sample standard deviation measures the spread of the data points around the sample mean.
- Calculate the standard error: The standard error is the standard deviation divided by the square root of the sample size (( \sqrt{n} )).
- Apply the t-score formula: Subtract the population mean from the sample mean, and divide by the standard error.
This gives you the t-statistic, which tells you how many standard deviations the sample mean is away from the population mean.
How to Calculate Total T-Score?
The total t-score is the t-statistic you calculate when performing a t-test to test the difference between a sample mean and a population mean (or between two sample means). To find the total t-score:
- Calculate the t-score for each data point: Use the formula:
[
t = \frac{\overline{X} – \mu}{\frac{s}{\sqrt{n}}}
] - Compare the test statistic with the critical value from the t-table to determine whether the observed difference is statistically significant.
If you are performing a two-sample t-test, you may need to calculate the t-scores for both samples and compare the means to determine if the observed difference is statistically different.
How to Calculate T-Score in Calculator?
To calculate the t-score using a calculator:
- Input your data into the calculator or statistical software. If you’re using a scientific calculator, you’ll need to calculate the mean and standard deviation manually, and input these values into the t-score formula.
- Use the t-test function: Many statistical calculators or software like Excel, R, or SPSS offer built-in t-test functions where you simply input your sample data, and the calculator will automatically compute the t-score.
- Compare your test statistic with the critical value from the t-table based on the degrees of freedom (df) and the significance level of your test.
The critical t-value depends on the confidence interval you are using and the degrees of freedom (which is calculated as the number of observations minus one, ( n – 1 )).