What To Know
- A test statistic is a value calculated from sample data that helps determine whether to reject the null hypothesis in a hypothesis test.
- The test statistic is used to compare the observed data to a sampling distribution under the null hypothesis, and the result is interpreted using the p-value or critical value.
Test Statistic Formula: A Comprehensive Guide
In the world of statistical analysis, a test statistic is a crucial value used in hypothesis testing to determine whether to reject the null hypothesis or not. It plays a pivotal role in evaluating the significance of the data collected during an experiment or survey. Understanding how to calculate the test statistic and interpret it correctly is essential for drawing reliable conclusions. This post will provide an in-depth explanation of the test statistic formula, its use in hypothesis tests, and how to analyze your data.
What is a Test Statistic?
A test statistic is a value calculated from sample data that helps determine whether to reject the null hypothesis in a hypothesis test. It is used to measure how much the sample data deviates from the null hypothesis, which typically assumes no effect or no difference.
Common Test Statistics:
- Z-test: Used when the population variance is known and the sample size is large enough (n > 30).
- T-test: Used when the population variance is unknown, or the sample size is small (n < 30).
- Chi-squared test: Used to test the association between categorical variables.
- F-test: Used to compare variances between two samples.
The test statistic is used to compare the observed data to a sampling distribution under the null hypothesis, and the result is interpreted using the p-value or critical value.
How to Calculate a Test Statistic?
The Formula for Test Statistic Calculation
The general formula for a standardized test statistic is:
[
\text{Test Statistic} = \frac{\text{Sample Statistic} – \text{Population Parameter}}{\text{Standard Error}}
]
For example, in a t-test, the formula for the t-statistic is:
[
t = \frac{\overline{X} – \mu}{\frac{s}{\sqrt{n}}}
]
Where:
- ( \overline{X} ) = sample mean
- ( \mu ) = population mean
- ( s ) = sample standard deviation
- ( n ) = sample size
This formula measures how far the sample mean (( \overline{X} )) is from the population mean (( \mu )) in terms of the standard error.
Types of Tests and Test Statistics
One-Sample vs. Two-Sample Test Statistics
In hypothesis testing, you often perform either a one-sample or two-sample test depending on your data:
- One-sample t-test: Used when comparing the sample mean to a population mean.
- Two-sample t-test: Used when comparing the means of two independent samples to determine if there’s a significant difference between them.
One-Tailed and Two-Tailed Tests
- One-tailed tests test the direction of the effect (either greater than or less than).
- Two-tailed tests test if there is any significant difference (either direction) from the null hypothesis.
For example, if you want to test whether a new treatment is greater than the existing treatment, a one-tailed test might be appropriate. However, if you want to test whether the new treatment is different (either better or worse) from the existing treatment, a two-tailed test is more appropriate.
P-Value and Critical Value in Hypothesis Testing
The p-value and the critical value are essential components used alongside the test statistic to determine the outcome of a hypothesis test.
Understanding P-Value
The p-value represents the probability of obtaining a test statistic as extreme as the observed one, assuming the null hypothesis is true. A smaller p-value indicates stronger evidence against the null hypothesis. For example:
- If the p-value is less than the significance level ( \alpha ) (commonly 0.05), you reject the null hypothesis.
- If the p-value is greater than ( \alpha ), you fail to reject the null hypothesis.
Critical Value
The critical value is a threshold that defines the rejection region for the test statistic. If the calculated test statistic exceeds the critical value, the null hypothesis is rejected.
Using the Test Statistic to Make Decisions
Significance Level and Statistical Decisions
The significance level (α) is the probability threshold used to decide whether to reject or fail to reject the null hypothesis. A commonly used significance level is ( \alpha = 0.05 ).
- If the p-value is less than ( \alpha ), you reject the null hypothesis and conclude that the result is statistically significant.
- If the p-value is greater than ( \alpha ), you fail to reject the null hypothesis.
Two-Tailed and One-Tailed Tests
The type of test (one-tailed or two-tailed) will determine the critical value and how the test statistic is interpreted:
- In a two-tailed test, the rejection region is split between the two tails of the distribution.
- In a one-tailed test, the rejection region is located only in one tail of the distribution.
Example: One-Sample T-Test
Let’s go through an example of calculating the t-statistic for a one-sample t-test:
Problem:
A company claims their light bulbs last 1,200 hours on average. You want to test if their claim is accurate based on a sample of 25 light bulbs with a sample mean of 1,180 hours and a sample standard deviation of 50 hours.
Solution:
- Set up the hypotheses:
- Null hypothesis (( H_0 )): The average lifetime of the light bulbs is 1,200 hours.
- Alternative hypothesis (( H_a )): The average lifetime of the light bulbs is not 1,200 hours.
- Calculate the t-statistic:
[
t = \frac{1180 – 1200}{\frac{50}{\sqrt{25}}} = \frac{-20}{10} = -2
] - Find the p-value:
Using a t-distribution table or statistical software, you find that for ( 24 ) degrees of freedom (n – 1), the p-value associated with ( t = -2 ) is approximately 0.03. - Compare the p-value to the significance level:
- If ( \alpha = 0.05 ), the p-value (0.03) is less than the significance level, so you reject the null hypothesis.
Thus, there is enough evidence to suggest that the average lifetime of the light bulbs is not 1,200 hours.
Ready to master statistical testing and test statistics?
Whether you’re working with t-tests, ANOVA, or chi-squared tests, ResearchAnalysisHelp.com provides expert guidance to help you analyze data, calculate p-values, and reject the null hypothesis with confidence.
Here are some related assignments to help deepen your understanding of test statistics, hypothesis testing, and various statistical methods:
1. Calculating Test Statistics for a T-Test
- Assignment: Given a dataset, calculate the t-statistic using the formula for a one-sample t-test. Compare the sample mean to the population mean and determine whether to reject the null hypothesis using a significance level of 0.05. Analyze the p-value and conclude whether the results are statistically significant.
- Tools: Microsoft Excel or Statistical Software.
- Goal: Understand how to calculate and interpret the t-statistic in hypothesis testing.
2. Comparing Two Sample Means with a T-Test
- Assignment: Perform a two-sample t-test to compare the means of two different groups (e.g., test scores from two different schools). Calculate the t-statistic, determine the degrees of freedom, and find the associated p-value to decide whether to reject the null hypothesis.
- Tools: Excel, R, or SPSS.
- Goal: Gain experience in comparing means of two samples and interpreting the results using t-tests.
3. Chi-Squared Test for Independence
- Assignment: Use a chi-squared test statistic to test for the association between two categorical variables (e.g., gender and voting preference). Calculate the expected frequencies, chi-squared statistic, and the p-value. Determine whether to reject the null hypothesis based on the chi-squared distribution.
- Tools: Excel, R, or SPSS.
- Goal: Learn how to perform a chi-squared test to analyze categorical data.
4. Performing ANOVA for Multiple Groups
- Assignment: Conduct a one-way ANOVA to compare the means of three or more groups. Calculate the F-statistic, determine the degrees of freedom, and find the p-value. Decide whether to reject the null hypothesis based on the significance level of 0.05.
- Tools: Excel, R, or SPSS.
- Goal: Understand how to use ANOVA to compare the means of multiple groups.
5. Performing a Z-Test for Proportions
- Assignment: Calculate the z-statistic for a sample proportion and compare it to a population proportion. Use the z-test formula and normal distribution to determine whether to reject the null hypothesis for a proportion hypothesis test.
- Tools: Excel or Statistical Software.
- Goal: Practice using the z-test to compare sample proportions with population proportions.
6. Power Analysis and Type I & II Errors
- Assignment: Perform a power analysis to determine the likelihood of detecting a statistically significant result (given the sample size and effect size). Discuss the type I error (false positive) and type II error (false negative) in the context of statistical testing.
- Tools: Statistical software (e.g., G*Power).
- Goal: Understand the relationship between power, sample size, and error types in hypothesis testing.
7. Confidence Intervals and Significance Testing
- Assignment: For a given sample, calculate the confidence interval for the population mean and compare it to the null hypothesis value. Discuss how the confidence interval can help you determine whether to reject the null hypothesis.
- Tools: Excel, R, or SPSS.
- Goal: Learn how to calculate and interpret confidence intervals and understand their role in hypothesis testing.
8. Comparing Two Variances Using an F-Test
- Assignment: Use an F-test to compare the variances of two independent samples. Calculate the F-statistic, degrees of freedom, and determine whether the difference in variances is statistically significant.
- Tools: Excel, R, or SPSS.
- Goal: Gain experience with the F-test for comparing the variances of two samples.
9. Two-Tailed vs. One-Tailed Tests
- Assignment: Given a hypothesis about a population mean, perform both a one-tailed and two-tailed test. Calculate the test statistic, p-value, and make decisions about whether to reject or fail to reject the null hypothesis for each type of test.
- Tools: Excel or Statistical Software.
- Goal: Understand the difference between one-tailed and two-tailed tests and when to use each.
10. Multiple Testing Correction Using the Bonferroni Method
- Assignment: Perform multiple hypothesis tests on several datasets (e.g., testing the effect of different variables on a response). Apply the Bonferroni correction to adjust for the increased risk of a type I error and interpret the adjusted p-values.
- Tools: Excel, R, or SPSS.
- Goal: Learn how to correct for multiple comparisons using Bonferroni’s correction and avoid false positives.
These assignments will help you apply statistical methods like t-tests, ANOVA, and chi-squared tests, and deepen your understanding of hypothesis testing, test statistics, and the role of p-values in statistical decision-making. By practicing these assignments, you’ll enhance your ability to analyze data and make informed decisions based on statistical evidence.
Conclusion
The test statistic formula is a vital tool in hypothesis testing that helps to quantify the difference between sample data and the null hypothesis. By calculating the test statistic, analyzing the p-value, and comparing it to the critical value, you can make informed decisions about whether to reject the null hypothesis. Whether you’re using t-tests, z-tests, or chi-squared tests, the ability to properly calculate and interpret test statistics is essential in statistical methods and drawing meaningful conclusions from data.
To learn more about hypothesis testing, test statistics, and how to analyze data effectively, visit Research Analysis Help and get expert guidance on your statistical needs.
FAQs:
What is the Formula for the Test Statistic?
The test statistic is a value used in statistical testing to determine whether the null hypothesis can be rejected. The formula for the test statistic depends on the type of test being performed. In general, the formula is:
[
\text{Test Statistic} = \frac{\text{Sample Statistic} – \text{Population Parameter}}{\text{Standard Error}}
]
For example:
- In a t-test, the formula is: [
t = \frac{\overline{X} – \mu}{\frac{s}{\sqrt{n}}}
] Where:- ( \overline{X} ) is the sample mean
- ( \mu ) is the population mean
- ( s ) is the sample standard deviation
- ( n ) is the sample size
This formula measures how far the sample mean is from the population mean in terms of the standard error of the sample.
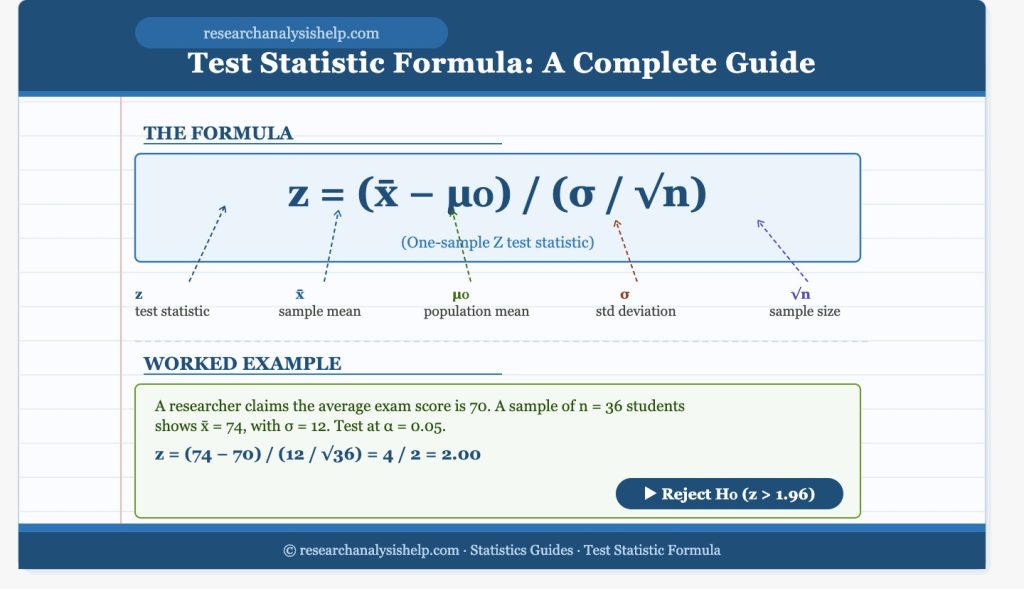
- For a z-test: [
z = \frac{\overline{X} – \mu}{\frac{\sigma}{\sqrt{n}}}
] Where ( \sigma ) is the population standard deviation. This is commonly used when the sample size is large enough or the population variance is known.
The test statistic helps us quantify how much the data deviates from the null hypothesis. From here, we can find p-values and determine whether to reject the null hypothesis based on the significance level.
How Do You Calculate the T-Statistic?
The t-statistic is used in t-tests to test whether the sample mean is significantly different from the population mean or whether two sample means are significantly different from each other. Here’s how you calculate it:
Formula for the One-Sample T-Test:
[
t = \frac{\overline{X} – \mu}{\frac{s}{\sqrt{n}}}
]
Where:
- ( \overline{X} ) = sample mean
- ( \mu ) = population mean (under the null hypothesis)
- ( s ) = sample standard deviation
- ( n ) = sample size
For two-sample t-tests, you can calculate the t-statistic using:
[
t = \frac{(\overline{X}_1 – \overline{X}_2)}{\sqrt{\frac{s_1^2}{n_1} + \frac{s_2^2}{n_2}}}
]
Where:
- ( \overline{X}_1, \overline{X}_2 ) are the sample means
- ( s_1^2, s_2^2 ) are the sample variances
- ( n_1, n_2 ) are the sample sizes
Key Considerations:
- A large enough sample is required for the t-statistic to follow a normal distribution (especially in small sample sizes).
- The p-value associated with the t-statistic helps you determine whether the difference between the sample mean and the population mean is statistically significant.
- If the p-value is less than the significance level of 0.05, you can reject the null hypothesis.
What is the Formula for the Chi-Squared Test Statistic?
The chi-squared test statistic is used in tests for independence and goodness of fit, particularly with categorical data. The formula for the chi-squared statistic is:
[
\chi^2 = \sum \frac{(O_i – E_i)^2}{E_i}
]
Where:
- ( O_i ) = observed frequency
- ( E_i ) = expected frequency
This formula calculates the sum of squared differences between observed and expected frequencies, normalized by the expected frequencies. The higher the difference, the higher the chi-squared statistic. This statistic follows a chi-squared distribution and is used to find the p-value, which can indicate whether there is a significant association between the categorical variables.
Example:
For a 2×2 table (e.g., testing independence between two categorical variables), you calculate the expected frequency for each cell, subtract the observed frequency from it, square the result, divide by the expected frequency, and sum the results.
When Should I Use an ANOVA or T-Test?
Both ANOVA (Analysis of Variance) and t-tests are used to compare means, but the choice between them depends on the number of groups you’re comparing.
Use a T-Test when:
- You are comparing the means of two groups (e.g., a two-tailed t-test).
- You have one sample and are testing the mean against a known population mean (i.e., a one-sample t-test).
- The sample size is relatively small, and the data is assumed to follow a normal distribution.
Use ANOVA (Analysis of Variance) when:
- You are comparing the means of three or more groups.
- You want to determine whether there are any statistically significant differences among the means of several groups based on variances.
Example:
- T-test: Comparing the average test scores between two teaching methods.
- ANOVA: Comparing the average test scores across multiple teaching methods.
In ANOVA, the F-test is used to compare the variances of the groups, and if the p-value is less than 0.05, you can reject the null hypothesis.
Decision-Making:
- If you’re comparing two means, a t-test is generally more appropriate.
- For comparing more than two means, ANOVA is typically the better choice.
- Both tests rely on the concept of significance level ( \alpha ), usually set to 0.05, and help you decide whether the observed differences are due to chance or are statistically significant.
Summary: Key Takeaways
- Test Statistic: A measure used in statistical testing to determine if the observed data supports the null hypothesis or an alternative hypothesis.
- T-Statistic: Calculated using the sample mean, population mean, standard deviation, and sample size. It’s used in t-tests for small samples or unknown population variance.
- Chi-Squared Statistic: Used for categorical data to test the association between variables.
- ANOVA vs. T-Test: Use a t-test when comparing two groups, and ANOVA when comparing more than two groups.
- P-value: The probability of observing the test statistic given that the null hypothesis is true. A p-value less than 0.05 typically leads to rejecting the null hypothesis.
Whether you’re performing t-tests, ANOVA, or other statistical methods, ResearchAnalysisHelp.com offers expert assistance in statistical testing, analyzing data, and ensuring that your results are statistically significant.
Feel free to reach out to us for more guidance on test statistics, hypothesis testing, and statistical analysis!