What To Know
- A box and whisker plot, often referred to as a box plot, is a powerful statistical tool used to visually display the distribution and variability of a data set.
- It consists of a rectangle (the “box”) that represents the interquartile range (IQR), along with whiskers that extend from the box to show the minimum and maximum values in the dataset.
How to Make a Box and Whisker Plot: A Step-by-Step Guide with Examples
A box and whisker plot, often referred to as a box plot, is a powerful statistical tool used to visually display the distribution and variability of a data set. It helps to summarize a set of numeric values by displaying key summary statistics such as the minimum, maximum, median, and quartiles. In this blog post, we will break down the components of a box and whisker chart and guide you through creating one using tools like Excel and other resources like Desmos.
Whether you’re working with test scores, financial data, or any other set of numerical values, this guide will equip you with the knowledge you need to make a box and whisker plot. So, let’s dive into understanding the key terms and how to construct a box plot.
What is a Box and Whisker Plot?
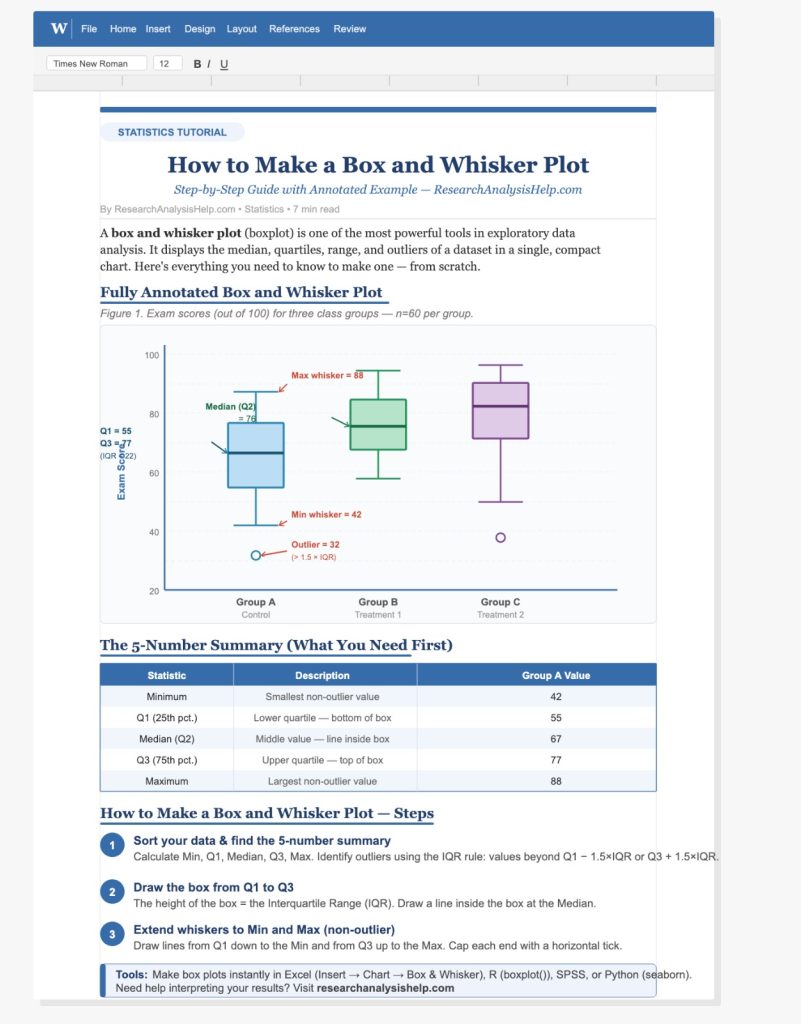
A box and whisker plot is a type of graphical representation that displays the spread and central tendency of data points. It consists of a rectangle (the “box”) that represents the interquartile range (IQR), along with whiskers that extend from the box to show the minimum and maximum values in the dataset. Outliers are shown as points outside the whiskers, helping to identify extreme values.
Key Components of a Box and Whisker Plot:
- Box: The central part of the plot, representing the interquartile range (IQR) — the range between Q1 (the lower quartile) and Q3 (the upper quartile).
- Whiskers: Lines extending from the box that indicate the range of the data. The lower whisker reaches from the box to the minimum value, while the upper whisker extends to the maximum.
- Median: The middle value of the dataset, dividing the data into two halves. It is marked by a vertical line inside the box. If you have an inclusive median, it will account for an even number of data points.
- Outliers: Data points that fall significantly outside the range of the whiskers. These are often displayed as points outside the whiskers.
Steps to Make a Box and Whisker Plot in Excel
Step 1: Prepare Your Data Set
To create a box plot in Excel, you first need to have a data set. For example, let’s say we have the following test scores as our raw data:
45, 56, 67, 78, 79, 80, 84, 90, 95, 98, 100
This is your column of numbers which you will use to calculate the summary statistics like the median, quartiles, and outliers.
Step 2: Calculate the Quartiles
Quartiles are crucial to the box and whisker plot as they divide your dataset into four equal parts. To create the plot, you will need to calculate the lower quartile (Q1), median (Q2), and upper quartile (Q3).
- Q1 (Lower Quartile): The median of the lower half of the data (below the median of the entire dataset).
- Q2 (Median): The middle value of the entire data set, which divides it into two equal parts.
- Q3 (Upper Quartile): The median of the upper half of the data (above the median of the entire dataset).
In Excel, you can use the QUARTILE function to calculate Q1 and Q3, and the MEDIAN function to calculate the median.
Example of quartile calculation in Excel:
=QUARTILE(A1:A11, 1)  'For Q1
=MEDIAN(A1:A11)        'For Q2 (Median)
=QUARTILE(A1:A11, 3)   'For Q3
Step 3: Identify the Minimum and Maximum Values
To create your whiskers, you will need to determine the minimum and maximum values in your data set. The whiskers will extend to these points, showing the full range of your data.
In Excel, you can use the MIN and MAX functions to calculate the minimum and maximum:
=MIN(A1:A11)  'For minimum
=MAX(A1:A11)  'For maximum
Step 4: Create the Box and Whisker Chart
Once you have calculated the summary statistics (minimum, Q1, median, Q3, and maximum), you’re ready to create the plot. In Excel, follow these steps:
- Highlight your data set.
- Go to the Insert tab in Excel.
- Click on Insert Statistic Chart and select Box and Whisker.
- Excel will automatically create a box-and-whisker plot based on the data.
Understanding the Whiskers and Outliers
In the whisker plot, the whiskers extend to the minimum and maximum values within 1.5 times the interquartile range (IQR). Any data points outside this range are considered outliers. These points are typically displayed as individual dots or asterisks.
For example:
- IQR Calculation: The IQR is calculated as
Q3 - Q1. This gives you the spread of the middle 50% of your data. - Outliers: If a data point is greater than
Q3 + 1.5 * IQRor less thanQ1 - 1.5 * IQR, it is considered an outlier.
Example of Outliers:
In the dataset mentioned earlier, if a score of 120 appeared, it would be considered an outlier because it falls outside the whiskers.
How to Interpret a Box and Whisker Plot
When looking at a box plot or whisker chart, here’s what to look for:
- The box: Represents the interquartile range (IQR), where most of the data points are clustered.
- The line inside the box (Median): This is the median value of the data set, which divides the data into two halves.
- The whiskers: Extend from the box to the minimum and maximum values, showing the spread of the data.
- Outliers: Points outside the whiskers are marked as outliers.
Box and Whisker Plot Example in Desmos
You can also create a whisker plot in Desmos, a popular online graphing calculator. Here’s how:
- Go to Desmos.
- Enter your dataset into the input bar.
- Use the built-in box plot function to visualize your data set.
Why Use a Box and Whisker Plot?
A box-and-whisker plot is a great way to quickly summarize and analyze a data set. It highlights:
- Central tendency (the median).
- Spread of the data (through the interquartile range (IQR)).
- Variability (the whiskers and outliers).
It is particularly useful when comparing multiple datasets side-by-side to observe how their distributions differ. This makes it a powerful tool in statistical analysis.
Ready to take your data analysis skills to the next level?
Whether you’re working with complex datasets or need help creating a box and whisker plot in Excel, Research Analysis Help is here for you.
Here are some related assignments that might help further your understanding and application of box and whisker plots and statistical analysis:
1. Data Analysis with Box and Whisker Plots
- Assignment: Create a box and whisker plot for a dataset of your choice (e.g., test scores, monthly sales, etc.). Calculate the minimum, maximum, Q1, Q2 (median), and Q3 for the dataset. Identify any outliers and explain their significance.
- Tools: Microsoft Excel, Desmos, or any other graphing software.
2. Comparing Two Datasets Using Box Plots
- Assignment: Use two different datasets (e.g., performance scores of two different classes or sales data of two stores) and create side-by-side box plots. Compare the interquartile ranges, medians, and outliers between the two datasets. Write a report explaining the differences and what they suggest about the data.
- Tools: Microsoft Excel (using whisker charts in Excel) or any graphing tool.
3. Exploring the Relationship Between Variables with Box Plots
- Assignment: Collect data on two variables (e.g., age and income, test scores and hours studied) and create a box and whisker plot for each variable. Analyze the distribution of each variable and explore whether any trends or relationships emerge.
- Tools: Microsoft Excel, Desmos, or similar tools.
4. Outliers Detection Using Box-and-Whisker Plots
- Assignment: Given a dataset, create a box and whisker plot and identify any outliers. Use the IQR method (1.5 * IQR rule) to mathematically verify whether the identified outliers fall outside the expected range. Discuss the potential impact of these outliers on the dataset’s analysis.
- Tools: Excel, R, or Python.
5. Summary Statistics and Box Plot Interpretation
- Assignment: Given a dataset, calculate the summary statistics (mean, median, mode, quartiles, IQR, etc.) and create a box plot for the data. Write a report summarizing the spread, central tendency, and variability of the data, using the box plot and statistical measures as evidence.
- Tools: Excel, R, or Python.
6. Using Box and Whisker Plots for Comparative Analysis
- Assignment: Compare the box and whisker plot of two different groups (e.g., different demographics, time periods, or conditions) and analyze how their data distributions differ. Discuss potential reasons for the differences and what they suggest.
- Tools: Excel, Google Sheets, or any graphing software.
7. Quartile Calculation and Box Plot Creation in Excel
- Assignment: Given a set of data, calculate the quartiles (Q1, Q2, Q3) and IQR manually, then use Microsoft Excel to create a box plot based on these values. Compare the results with other visual representations (e.g., histograms) and explain the advantages of using box plots for certain types of data analysis.
- Tools: Microsoft Excel (using format data series for box plots).
8. Exploring Data Variability Through Whisker Charts
- Assignment: Use a whisker chart in Excel to visualize the variability in a dataset. Discuss the importance of IQR and the whiskers in understanding the spread and extreme values in the data.
- Tools: Excel, Google Sheets.
9. Creating a Histogram vs. Box Plot
- Assignment: For a given dataset, create both a histogram and a box plot. Compare and contrast the two visualizations, explaining when it is more appropriate to use a box and whisker plot over a histogram, and vice versa.
- Tools: Excel, Google Sheets, R, or Python.
10. Box Plot Analysis for Survey Data
- Assignment: If you’ve collected survey data, create a box and whisker plot for the responses to numerical questions (e.g., satisfaction ratings, income levels). Interpret the box plot to identify trends, outliers, and general distributions in the responses.
- Tools: Excel or Google Sheets.
These assignments will help you practice and refine your ability to use box plots and understand their role in statistical analysis. By working with different datasets and scenarios, you’ll enhance your skills in data visualization and interpretation, making you more proficient in using these tools for analysis.
Conclusion
Creating a box and whisker plot is an essential skill for anyone working with data sets and statistical analysis. Whether you’re using Excel, Desmos, or another tool, knowing how to calculate quartiles, medians, and identify outliers is crucial for effective data analysis. Now that you know how to make a box and whisker plot, you can apply this knowledge to any set of numerical values, helping you gain insights into the variability and distribution of your data.
By following the step-by-step guide in this tutorial, you can confidently generate whisker plots and box plots to visualize your data and make informed decisions based on the summary statistics you gather.
If you’re looking for further help with box and whisker plots, quartile calculation, or statistical analysis in Excel, reach out to Research Analysis Help for expert guidance and support!
FAQs:
How Do You Make a Box and Whisker Plot Step by Step?
Making a box and whisker plot is easy to do using tools like Microsoft Excel. Here’s a step-by-step guide:
- Prepare Your Data:
- Organize your values in the data from smallest to largest.
- Make sure the sample size is large enough to generate meaningful insights.
- Calculate Key Statistical Values:
- Q1 (Lower Quartile): This is the median of the lower half of the data.
- Q2 (Median): The middle value that divides your data into two halves.
- Q3 (Upper Quartile): This is the median of the upper half of the data.
- Minimum and Maximum: The whiskers extend to these values.
- Plot the Box and Whiskers:
- Create a number line and mark the minimum, Q1, median, Q3, and maximum on it.
- The box spans from Q1 to Q3, and a line is drawn at the median.
- Whiskers extend from the box to the minimum and maximum, representing the range of the data.
- Any values outside the whiskers are shown as outliers.
- Format the Data Series:
- In Microsoft Excel, use the whisker chart in Excel feature to visually represent the data.
- Adjust the chart’s appearance and format data series for clarity.
- Review the Plot:
- A box and whisker plot gives a clear graphical representation of the data’s spread, central tendency, and variability.
How Do You Find Q1 and Q3 in a Box Plot?
To find Q1 (the lower quartile) and Q3 (the upper quartile), follow these steps:
- Order Your Data: Arrange your data points from smallest to largest.
- Find Q2 (Median): This is the middle value of the data. If the number of data points is odd, the median is the middle number. If even, take the average of the two middle values.
- Calculate Q1 (Lower Quartile): Q1 is the median of the lower half of the data (below Q2).
- Calculate Q3 (Upper Quartile): Q3 is the median of the upper half of the data (above Q2).
For example, given a set of data like:
6, 7, 9, 9, 20, 22, 26, 28, 29, 30
- Q1 would be the median of 6, 7, 9, 9, which is 8.
- Q3 would be the median of 22, 26, 28, 29, 30, which is 27.
What Are the 5 Values Needed to Make a Box and Whisker Plot?
To create a box and whisker plot, five key values are essential:
- Minimum: The smallest value in the data set.
- Q1 (Lower Quartile): The median of the lower half of the data.
- Median (Q2): The middle value of the data set, dividing the data into two equal parts.
- Q3 (Upper Quartile): The median of the upper half of the data.
- Maximum: The largest value in the data set.
These five values are used to construct the box (spanning from Q1 to Q3) and the whiskers (extending to the minimum and maximum). The whiskers represent the spread of the data, and any data points outside the whiskers are often marked as outliers.
Which Box and Whisker Plot Represents This Data: 6, 7, 9, 9, 20, 22, 26, 28, 29, 30?
Given the data set:
6, 7, 9, 9, 20, 22, 26, 28, 29, 30
We can break it down to identify the key statistics for the box and whisker plot:
- Minimum: 6
- Q1 (Lower Quartile): 8 (median of 6, 7, 9, 9)
- Median (Q2): 20 (middle value of the data set)
- Q3 (Upper Quartile): 27 (median of 22, 26, 28, 29, 30)
- Maximum: 30
Box Plot Representation:
- The box will span from Q1 (8) to Q3 (27).
- The whiskers will extend from 6 (minimum) to 30 (maximum).
- Outliers: There are no outliers in this data, as all values lie within the whiskers.
- The whiskers represent the range from 6 to 30, and the box shows the interquartile range, highlighting the upper and lower quartiles.
Using Excel or any graphing tool, you can create a whisker chart in Excel to visualize this data with a sample chart. The whiskers will show the variability and spread, and the box will represent the interquartile range.
By understanding how to calculate the minimum, Q1, median, Q3, and maximum, you’ll be able to create an effective box and whisker plot. Whether you’re using a whisker plot in Excel or a histogram, this plot is invaluable for statistical analysis.