What To Know
- You can configure a dynamic axis by selecting the measure on the shelf and setting the scale to automatic, allowing Tableau to adjust it as you filter or manipulate the data.
- If you prefer, you can adjust the range to a custom value, for instance, setting the X-axis range from 0 to 1000 for sales or adjusting the Y-axis to focus on positive values or negative values depending on your analysis.
How to Change X and Y Axis in Tableau: A Comprehensive Guide
When working with data in Tableau, changing the X and Y axes is a crucial part of customizing your visualizations and making the insights clearer and more accessible. Whether you’re creating a dynamic axis or adjusting the axis ranges, understanding how to effectively manage your axes can enhance your visual analysis. This guide will walk you through the process of changing X and Y axes in Tableau, with examples, definitions, and tips to help you get the most out of your data.
What Are Axes in Tableau?
In Tableau, axes represent the dimensions or measures that are used to plot data on a chart. The X-axis is usually associated with the dimension or measure placed on the columns shelf, while the Y-axis is typically linked to the measure placed on the rows shelf.
- X-Axis: Usually represents the dimension (e.g., order date, category).
- Y-Axis: Typically represents the measure (e.g., sales, profit, quantity).
Both axes help organize and display the data in a meaningful way. Understanding how to edit the axis, swap axes, or customize them is vital to improving the clarity of your visualizations.
Step 1: Understand the Dynamic Axis Concept
A dynamic axis in Tableau adjusts automatically based on the data being displayed. It allows for flexibility, so when data changes (for example, when applying filters or parameters), the axis ranges will update accordingly to fit the new data set.
- Dynamic Axis: This is a feature that enables the axis to automatically scale depending on the data available. It’s especially useful when working with different data or aggregating measures.
Use Dynamic Axis
To use dynamic axis in Tableau, simply drag a measure (e.g., sales) or a dimension (e.g., region) into the rows shelf or columns shelf, and Tableau will automatically configure a dynamic axis based on your data.
- You can configure a dynamic axis by selecting the measure on the shelf and setting the scale to automatic, allowing Tableau to adjust it as you filter or manipulate the data.
Step 2: Changing the X and Y Axes in Tableau
When you’re working with a worksheet, changing the X and Y axes involves more than just moving fields. You can adjust the axis title, axis ranges, and scale to better visualize the data. Here’s how you can do it:
1. Edit the Axis Title
- Right-click on the axis title (either the X-axis or Y-axis).
- Select Edit Axis from the dropdown menu.
- You can modify the axis title, which will reflect the data that is being represented on the axis. For example, if you’re analyzing sales, change the title to “Sales (in USD).”
2. Edit the Axis Range
- In the Edit Axis dialog, you can change the axis range. Tableau allows you to define fixed axis ranges or let it be automatic.
- If you prefer, you can adjust the range to a custom value, for instance, setting the X-axis range from 0 to 1000 for sales or adjusting the Y-axis to focus on positive values or negative values depending on your analysis.
Example:
For a chart showing profit across different regions, you might want the Y-axis to show a range of -1000 to 10000 to capture both negative profit and positive profit across the regions.
3. Configure Axis Based on the Underlying Data
- Tableau uses the underlying data to automatically create axis ranges for continuous fields. However, you can fine-tune the axis range by adjusting the settings in the Edit Axis menu.
- For example, when dealing with a date field, Tableau can use a continuous axis or discrete axis depending on whether you’re looking at months, days, or a continuous timeline.
Step 3: Swap or Adjust the Axes
Switching or swapping the X and Y axes is a simple task in Tableau:
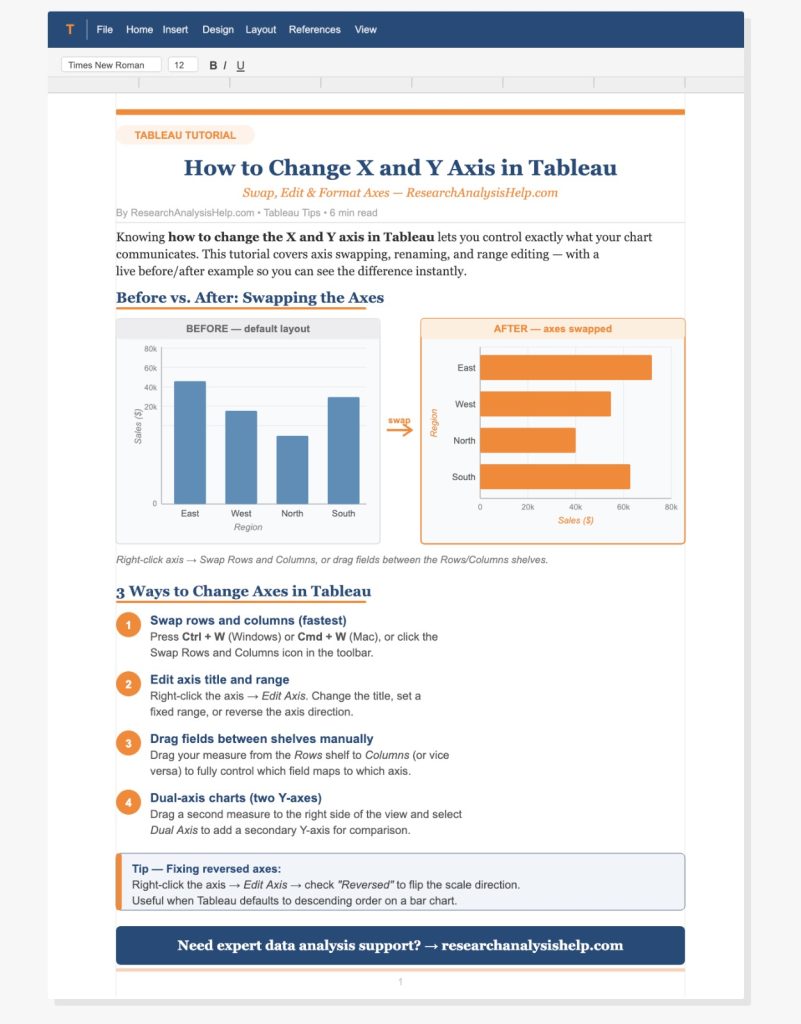
- Drag and Drop: You can swap axes by simply dragging a field from the columns shelf to the rows shelf (or vice versa).
- Right-click on the axis: Alternatively, right-click on the header of the X-axis or Y-axis and select Swap to switch the data points between the two axes.
This is useful if you want to visualize the data differently. For example, if you initially had sales on the X-axis and profit on the Y-axis, swapping them will show you a different perspective on the data.
Step 4: Customize Your Axis Ranges
In Tableau, you can customize axis ranges to make your visualizations more tailored to the data you’re analyzing:
1. Adjust for Two Measures
If you are working with two measures on a dual axis (e.g., sales and profit), you can synchronize or customize the ranges to make both measures visible on the same chart.
- Drag one measure into the columns shelf and the other into the rows shelf.
- Tableau will create a dual-axis chart, and you can then right-click on one of the axes and choose Synchronize Axis or manually format the ranges.
2. Customizing for Different Data Types
When working with discrete dimensions or continuous measures, the range of the axis will be automatically set by Tableau, but you can adjust it manually based on the data type:
- For continuous fields like sales, you may want a continuous axis scale, where Tableau automatically adjusts the axis range based on the data.
- For discrete dimensions, such as product categories, the axis will display individual points or labels rather than a continuous range.
Step 5: Using Parameters to Control Axes
A powerful feature in Tableau is the ability to use parameters to dynamically control the axis ranges. Here’s how to use them:
- Create a Parameter: Go to the Data pane, right-click, and select Create Parameter. Choose the desired data type (e.g., integer, float, or date) and set a range.
- Use Parameter in Axis Range: After creating the parameter, you can link it to the axis range in the Edit Axis dialog. For example, use a parameter to allow users to control the range of the Y-axis in your profit vs sales chart.
- Add Parameter Control to Dashboard: You can then add the parameter control to your dashboard to allow users to adjust the scale and range dynamically.
Ready to Master Tableau Axes and Visualizations?
At ResearchAnalysisHelp.com, we provide expert guidance and support for creating dynamic, interactive Tableau charts and dashboards.
Here are some related assignments that would benefit from understanding how to change x and y axis in tableau:
1. Dynamic Axis Configuration for Data Analysis Projects
Assignment Overview:
In this assignment, students will need to configure a dynamic axis for a dataset and analyze how different measures and dimensions affect the display on a chart. The task involves selecting and plotting continuous date data, adjusting axis ranges, and applying mark types to generate an interactive visualization.
Key Tasks:
- Calculate how different dimensions and measures influence the X and Y axes.
- Update the axis dynamically based on the data source.
- Format the axis to handle date dimension and continuous date properly.
- Apply appropriate mark properties to visualize trends clearly.
2. Creating Customized Charts in Tableau
Assignment Overview:
Create customized charts in Tableau using different dimensions and measures and adjusting axis range based on the dataset. Students will be required to format the X-axis and Y-axis for clarity and modify the header to reflect the appropriate data points.
Key Tasks:
- Control-click on Mac to select and format the columns or rows shelf.
- Adjust axis range to display more granular data based on selected measures.
- Populate the chart with supported field types and use mark types to customize how the data points are presented.
- Modify the subtitle to match the selected variables and provide clear context for your analysis.
3. Interactive Dashboard Development Using Dynamic Axes
Assignment Overview:
Develop a dashboard where the user can interact with dynamic axes to explore different subsets of data. This includes configuring axis labels to change dynamically based on dimensions and measures selected. The task will require configuring filters that update the axis based on user input.
Key Tasks:
- Generate a dynamic chart that updates when filters or parameters are changed.
- Ensure that axis ranges adjust to accommodate the filters, especially when date dimension data is involved.
- Adjust the scale of the chart to display horizontal data properly, and select the marks to highlight important insights.
4. Calculating and Visualizing Sales Performance with Dynamic Axis
Assignment Overview:
In this project, you will create a chart to visualize sales performance over time, utilizing dynamic axes. Students will need to adjust the Y-axis to reflect sales values, using different measures and dimensions to calculate and display performance data for multiple regions or products.
Key Tasks:
- Calculate sales figures and generate a chart that automatically adjusts based on changing data.
- Use supported field types to categorize data into columns or rows shelf.
- Format the chart to show data in horizontal orientation, making it easier to compare sales or profit across time.
- Ensure that users can update the axis by selecting different dimensions such as region or product type.
5. Creating Time Series Analysis Using Date Dimension
Assignment Overview:
Create a time series chart using the date dimension to analyze trends over time. This will involve configuring dynamic axes to account for both continuous date and discrete data. The goal is to visualize how a metric like sales or profit evolves, ensuring that the axis range is adjusted dynamically.
Key Tasks:
- Use date dimension and continuous date to plot trends over time.
- Format the X-axis to display time and Y-axis to show numeric data.
- Modify axis range based on the time span selected (e.g., yearly, quarterly, monthly).
- Populate the rows and columns shelves to create a clean, readable visualization for time series data.
6. Visualizing Sales Trends Across Different Dimensions
Assignment Overview:
In this task, you’ll create a chart to compare sales trends across different dimensions, like product categories or sales regions. You will need to configure a dynamic axis to automatically adjust based on the selected dimension, ensuring accurate visual comparisons between the various metrics.
Key Tasks:
- Select the marks on the rows or columns shelf to visualize different dimensions and measures.
- Use a parameter to allow users to control which dimension they view (e.g., region vs. category).
- Adjust mark properties to make sure that data points are displayed clearly on the chart.
- Update the axis to ensure that it adjusts dynamically with the selected data filters and axis ranges.
7. Parameter-Based Axis Customization for Interactive Charts
Assignment Overview:
Create an interactive chart that lets users control the axis display based on a chosen parameter value. This chart should adjust the axis range and display metrics like sales or profit dynamically, allowing users to switch between different measures.
Key Tasks:
- Format the axis based on user-selected parameters such as sales targets or profit margins.
- Edit the axis settings to allow dynamic scaling of the Y-axis when the user changes the parameter value.
- Use calculation fields to dynamically adjust the columns or rows shelf based on the selected metric.
- Ensure that users can see edit axes when interacting with the chart and changing the measure.
These assignments help you explore the full range of dynamic axis functionality in Tableau, from working with dimensions and measures to fine-tuning axis ranges. Whether you’re building interactive dashboards or performing detailed data analysis, learning how to manipulate axes effectively in Tableau will significantly enhance your data visualization skills.
Conclusion: Mastering Axes in Tableau for Better Visualizations
Changing and customizing the X and Y axes in Tableau is key to improving your data visualizations and providing more context to your audience. Whether you are working with a dynamic axis, continuous data, or two measures, Tableau provides the flexibility to adjust and optimize your axes for clarity.
By following the steps in this guide, you can configure dynamic axes, edit axis titles, format axis ranges, and make your charts more insightful. Whether you’re using parameters for dynamic control or simply swapping axes for a different perspective, these tools will help you visualize your data more effectively and create powerful visualizations for analysis.
Ready to take your Tableau visualizations to the next level? ResearchAnalysisHelp.com is here to assist you with any questions or challenges you may have in configuring your axes and improving your data visualizations. Reach out to us today and let us help you create impactful dashboards!
FAQs:
How to Change the X-Axis in Tableau?
To change the X-axis in Tableau, follow these steps:
- Drag Dimensions or Measures: Place your selected dimension or measure onto the columns shelf (for X-axis).
- Edit Axis: Right-click on the X-axis and select Edit Axis to modify the range, scale, or format.
- Update Axis: You can also use a parameter value or calculation to dynamically adjust the X-axis based on specific needs (e.g., sales or profit).
How to Change the Y-Axis in Tableau?
To change the Y-axis:
- Place Measures on Rows Shelf: Add the selected measure (e.g., sales or profit) to the rows shelf.
- Right-click and Edit: Right-click on the Y-axis and choose Edit Axis to adjust the axis range or format.
- Customize: You can format the axis to display numeric values or adjust based on your data source and mark type.
What is the X-Axis and Y-Axis in Tableau?
- X-Axis: The X-axis in Tableau typically represents dimensions or measures placed on the columns shelf. It often represents time (e.g., order date field) or categories like region or product.
- Y-Axis: The Y-axis represents measures (like sales or profit) and is usually placed on the rows shelf. It shows the numeric value associated with each category on the X-axis.
How Do You Reverse the X-Axis in Tableau?
To reverse the X-axis:
- Select the Axis: Right-click on the X-axis in your viz.
- Edit Axis: Select Edit Axis and then use the reverse option in the scale section.
- Hack for Customization: You can also use a calculation or parameter value to dynamically reverse the axis based on your selected measure.
These steps will help you reverse the axis for better visualization of your data.