What To Know
- In this comprehensive guide by ResearchAnalysisHelp, we’ll go beyond the basics and develop a deep understanding of the concept of n mean in statistics, including its definitions, applications, formulas, and its impact on statistical outcomes.
- In statistics, a statistic is a numerical value calculated from a sample.
What Does N Mean in Statistics? A Complete, In-Depth Guide for Researchers
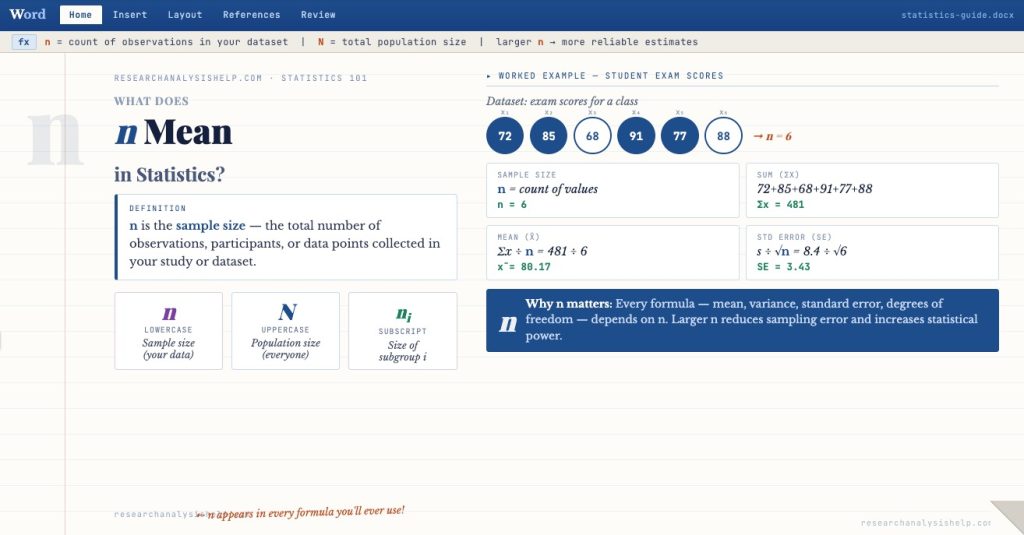
When working with data, one of the most frequently used symbols you’ll encounter is the letter ‘n’ in statistics. At first glance, it may seem simple—but in reality, ‘n’ plays a crucial role in almost every aspect of statistical analysis, from basic calculations to advanced modeling.
In this comprehensive guide by ResearchAnalysisHelp, we’ll go beyond the basics and develop a deep understanding of the concept of n mean in statistics, including its definitions, applications, formulas, and its impact on statistical outcomes.
Statistic
In statistics, a statistic is a numerical value calculated from a sample. The letter ‘n’ is foundational because it denotes the number of data points used to compute that value.
- ‘n’ refers to the total number of observations in a sample
- It is written in lowercase to distinguish it from population size (N)
- It represents the sample size in nearly all formulas
Example:
If a study collects responses from 120 participants:
- n = 120
- This means n is the total number of observations used in analysis
This value is essential when calculating:
- Sample mean
- Variance
- Standard deviation
- Test statistics
Without understanding ‘n’ in statistical notation, interpreting results becomes difficult.
Sampling
Sampling is the process of selecting a subset from a total population to make conclusions about that population.
Role of ‘n’ in Sampling:
- n for sample indicates how many units are selected
- It determines the quality of data collection
- A smaller sample may not reflect the population accurately
Key Insight:
- Larger samples improve statistical inference
- Small sample size increases the chance of bias
For example:
- Surveying 20 people (small sample size) vs 2,000 (large sample)
- The larger sample better represents the population mean
Sample Size
The sample size or number of observations (n) is one of the most critical components in research.
Definition:
- n is the number of observations in a dataset
- It directly influences the accuracy of results
Why Sample Size Matters:
- Sample size matters because it affects:
- Precision
- Reliability
- Statistical power
Key Principle:
- Larger sample size generally leads to more accurate results
- Larger sample sizes reduce random error
However, researchers must also consider:
- Cost of data collection
- Time constraints
- Diminishing returns beyond a certain size
Statistical
In any statistical process, ‘n’ affects almost everything:
- Standard error
- Confidence intervals
- Hypothesis testing
- Regression analysis
Key Relationship:
- Larger n → smaller error → higher accuracy
- Smaller n → higher variability → less confidence
This is why it’s important to know how sample size influences results.
Regression
In regression analysis, ‘n’ represents the number of observations used to build a model.
Example:
In a regression model:
[
Y = a + bX
]
- n − p is used for degrees of freedom
- p = number of predictors
- n = total observations
Why It Matters:
- Larger samples improve the ability to detect relationships
- Enhance predictive accuracy in data mining
Key Insight:
- With insufficient data points, regression models become unreliable
Equation
Statistical equations rely heavily on n.
Mean Formula:
[
\bar{x} = \frac{\sum x}{n}
]
- Used to calculate the mean
- Shows that n is the total number of observations
Standard Deviation Formula:
[
s = \sqrt{\frac{\sum (x – \bar{x})^2}{n-1}}
]
- Uses n-1 to account for independent pieces of information
This adjustment improves the estimate of the standard deviation of the population (σ).
Importance of Sample Size
The importance of sample size is central to statistical accuracy.
Benefits of Larger Sample Sizes:
- Larger sample size increases precision
- Improves statistical power
- Enhances the likelihood of detecting real effects
Trade-Offs:
- Cost and time increase with large sample sizes
- After a point, gains are minimal (diminishing returns)
Optimal Approach:
- Determining the optimal sample size depends on:
- Desired confidence level
- Expected effect size
- Study design
Standard Deviation
The standard deviation measures how spread out data is.
Role of ‘n’:
- Uses n-1 in calculations
- Reflects variability in data
Key Insight:
- Larger samples produce more stable estimates of dispersion
Mean in Statistics
The mean in statistics is the average value.
Formula:
[
\bar{x} = \frac{\sum x}{n}
]
- Relies directly on n
- Used in various statistical calculations
Variants:
- Arithmetic mean
- Geometric mean
Parameter
A parameter describes a population (e.g., population mean, σ).
Key Difference:
- Sample → uses n
- Population → uses N
Goal:
- Use sample data to estimate population parameters
Variance
Variance measures how far data points deviate from the mean.
Formula:
- Based on sum of squares
- Uses n or n-1
Importance:
- Helps quantify data distribution and spread
Estimate
An estimate is an approximation of a population value.
Example:
- Sample mean estimates population mean
Key Insight:
- Larger samples → more accurate estimates
- Improves reliability and validity
Sample Mean
The sample mean is central to statistics.
- Calculated using n
- Represents the average of data points
Key Role:
- Used in statistical inference
- Helps summarize data
Hypothesis
In hypothesis testing, n plays a crucial role.
Why It Matters:
- Larger samples improve the ability to detect differences
- Increase power of statistical tests
Process:
- Define null hypothesis
- Compute test statistics
- Decide whether to reject
Notation
In statistical notation:
- “n” denotes the number of observations
- Lowercase → sample
- Uppercase → population
Clear understanding of notation is essential for interpretation.
Confidence Intervals
Confidence intervals estimate a range for population values.
Role of ‘n’:
- Larger n → smaller standard error
- Produces narrower intervals
Result:
- More precise estimates of population parameters
Analysis of Variance
Analysis of variance (ANOVA) uses n to compare group means.
Key Components:
- Sum of squares
- Degrees of freedom (n − p)
Purpose:
- Compare multiple groups
- Analyze variability
ANOVA
In ANOVA, sample size affects:
- Accuracy
- Power
- Interpretation
Larger samples improve the ability to detect differences among groups.
Hypothesis Testing
In hypothesis testing, ‘n’ plays a crucial role in determining outcomes.
Effects:
- Larger samples → stronger conclusions
- Improve statistical inference
Population Parameters
The goal of statistics is estimating population parameters.
Role of ‘n’:
- Helps approximate:
- Population mean
- Standard deviation of the population (σ)
Impact on Statistical
The impact on statistical results is significant.
Key Effects:
- Influences test statistics
- Affects confidence intervals
- Determines reliability and validity
Get Professional Help with Your Statistics Today
Still confused about concepts like “n” in statistics, probability symbols, or choosing the right approach for your research? You don’t have to figure it out alone.
Here are relevant assignments you can use for coursework, practice, or academic projects related to what ‘n’ means in statistics and its applications:
1. Understanding ‘n’ in Statistics Assignment
Task:
Explain what ‘n’ means in statistics and describe its role in data analysis.
Requirements:
- Define:
- ‘n’ in statistics
- Difference between n (sample size) and N (population size)
- Explain how ‘n’ refers to the total number of observations
- Provide examples from real datasets
Goal:
Build a strong understanding of the concept and why it’s important to know how sample size affects results.
2. Sample Size and Statistical Accuracy Assignment
Task:
Analyze how sample size matters in statistical studies.
Focus on:
- Small sample size vs large sample sizes
- Impact on:
- Standard error
- Confidence intervals
- statistical power
Discussion Points:
- Why larger sample size generally leads to more accurate results
- Concept of diminishing returns
- Determining the optimal sample size
3. Mean, Variance, and Standard Deviation Assignment
Task:
Use a dataset to:
- Calculate the mean
- Calculate the standard deviation
- Compute variance
Requirements:
- Show formulas using n and n-1
- Interpret results in terms of variability
- Compare sample mean with population mean
4. Hypothesis Testing and Sample Size Assignment
Task:
Conduct hypothesis testing using datasets with different sample sizes.
Steps:
- Define:
- Null hypothesis
- Alternative hypothesis
- Perform statistical testing
- Analyze how n plays a crucial role in:
- Ability to detect effects
- Likelihood of detecting significance
5. Regression Analysis Assignment
Task:
Perform a regression analysis and interpret results.
Requirements:
- Define:
- Independent variables
- Dependent variables
- Explain role of n − p (degrees of freedom)
- Discuss how number of observations affects model accuracy
6. ANOVA and Sample Size Assignment
Task:
Use analysis of variance (ANOVA) to compare groups.
Include:
- Calculation of:
- Sum of squares
- Degrees of freedom (n − p)
- Explain how sample size or number impacts results
- Interpret findings
7. Confidence Intervals Assignment
Task:
Construct confidence intervals for a dataset.
Focus:
- Relationship between:
- Sample size
- Standard error
- Show how larger samples produce narrower intervals
8. Statistical Notation and Interpretation Assignment
Task:
Explain key statistical notation.
Include:
- Meaning of:
- “n”
- σ (standard deviation of the population)
- Explain how notation is used in various statistical formulas
9. Data Collection and Sample Design Assignment
Task:
Design a data collection plan.
Requirements:
- Decide sample size
- Justify based on:
- Population size
- Desired accuracy
- Explain how researchers must ensure:
- Reliability and validity
10. Impact of Sample Size on Statistical Outcomes Assignment
Task:
Evaluate the impact on statistical results when sample size changes.
Analyze:
- Changes in:
- Test statistics
- Confidence intervals
- statistical inference
Conclusion:
Explain how researchers can enhance results by selecting the right sample size.
Final Tip
These assignments will help you:
- Understand the role of ‘n’ in statistics
- Apply concepts across hypothesis testing, regression, and ANOVA
- Improve the outcome of statistical analyses
- Larger sample size generally leads to more accurate and reliable results
- Enables researchers to draw stronger conclusions
Final Thoughts
Understanding what ‘n’ means in statistics is fundamental for every researcher. The letter ‘n’ represents the sample size, and it directly influences the outcome of statistical analyses.
Key Takeaways:
- ‘n’ refers to the total number of observations
- It affects:
- Hypothesis testing
- Regression analysis
- ANOVA
- Sample size matters for accuracy and validity
Why It Matters:
By mastering the role of ‘n’, researchers can:
- Improve statistical inference
- Enhance the reliability and validity of results
- Make informed, data-driven decisions
Need Expert Help?
At ResearchAnalysisHelp.com, we help you:
- ✔️ Understand complex statistical concepts
- ✔️ Choose the right methods
- ✔️ Perform accurate analyses
👉 Get expert support today and elevate your research with confidence!
FAQs:
Here are clear, expert-crafted FAQ answers—blending concise bullet points with explanatory prose—tailored to highlight the expertise of ResearchAnalysisHelp.com:
What is an n value in statistics?
The “n” value in statistics refers to the sample size, or the total number of observations collected in a study.
- “n” denotes how many data points are included in your analysis
- It is used in calculations such as mean, variance, and hypothesis testing
- It directly affects accuracy, reliability, and statistical power
In practical terms, whether you’re working with numerical or categorical data, the value of “n” determines how representative your findings are. A well-chosen sample size—including the desired level of confidence and precision—ensures meaningful and trustworthy results.
At ResearchAnalysisHelp.com, we help you determine the right “n” so your research is both statistically valid and academically strong.
What is the N symbol in statistics?
The uppercase N symbol in statistics represents the total population size, as opposed to lowercase “n”, which refers to a sample.
- N = total population
- n = sample drawn from that population
Example:
- If a university has 5,000 students → N = 5000
- If you survey 200 students → n = 200
Understanding this distinction is critical, especially when working with categorical variables or large datasets. It helps researchers decide how much data to collect and how to generalize findings accurately.
What does the ∩ symbol mean in probability?
The ∩ symbol in probability represents the intersection of two events—meaning both events occur together.
- It is read as “A intersection B”
- It shows outcomes that are common to both events
Example:
If:
- A = students who study statistics
- B = students who use SPSS
Then:
- A ∩ B = students who do both
This concept is essential in probability, especially when analyzing relationships in categorical data and understanding overlapping outcomes.
What does n stand for in research?
In research, “n” stands for the number of observations or participants in a study.
- It reflects how much data has been collected
- It influences the strength of conclusions
- It helps determine the number of independent pieces of information available for analysis
Why It Matters:
- A larger “n” increases reliability
- A smaller “n” may limit generalizability
- Proper sample size planning (including the desired level of accuracy) improves results
Whether you’re analyzing survey responses, experiments, or categorical data, understanding “n” is essential for valid conclusions.
At ResearchAnalysisHelp.com, we guide researchers in selecting and justifying the right sample size, ensuring high-quality and credible outcomes.
Need Expert Help?
If you’re unsure about sample size, statistical symbols, or probability concepts, ResearchAnalysisHelp.com offers:
- ✔️ Personalized statistical guidance
- ✔️ Help with research design and data analysis
- ✔️ Clear explanations tailored to your assignment
👉 Get expert support today and make your research accurate, reliable, and stress-free!