What To Know
- The p-value is a fundamental concept in statistical hypothesis testing, helping researchers determine whether the test statistic provides enough evidence to reject the null hypothesis.
- It represents the probability of obtaining a test statistic at least as extreme as the one observed in your data, assuming that the null hypothesis is true.
How to Find P-Value: A Comprehensive Guide to Interpreting Results in Hypothesis Testing
The p-value is a fundamental concept in statistical hypothesis testing, helping researchers determine whether the test statistic provides enough evidence to reject the null hypothesis. Understanding how to find p value and correctly interpret p-values is essential for drawing meaningful conclusions from data.
In this extensive guide, we will explore what a p-value is, how to calculate p-values, and how to interpret them in the context of various statistical tests, including z-tests, t-tests, and chi-square tests.
What is a P-Value?
A p-value is a probability that measures the strength of evidence against the null hypothesis. It represents the probability of obtaining a test statistic at least as extreme as the one observed in your data, assuming that the null hypothesis is true. In other words, it tells you how likely your observed data is due to random chance.
- A low p-value (typically less than 0.05) suggests strong evidence against the null hypothesis, indicating that the observed result is statistically significant.
- A high p-value suggests weak evidence against the null hypothesis, meaning the observed result could likely be due to random chance, and the null hypothesis should fail to be rejected.
P-Value and Statistical Significance
- The p-value is used in hypothesis testing to determine whether to reject the null hypothesis.
- Statistical significance is usually assessed using a significance level (α), often set at 0.05 (5%) or 0.01 (1%).
- If the p-value is less than α, the result is statistically significant, and we reject the null hypothesis.
- If the p-value is greater than α, we fail to reject the null hypothesis.
How to Calculate P-Value
The process of calculating the p-value depends on the test statistic used in your hypothesis test. Here are the basic steps for calculating the p-value:
- State the Hypotheses:
- Null hypothesis (H₀): Assumes no effect or no difference.
- Alternative hypothesis (H₁): Assumes a significant effect or difference.
- Choose the Test Type:
- For example, use a z-test for large sample sizes or known population standard deviation, a t-test for smaller sample sizes or unknown population standard deviation, and a chi-square test for categorical data.
- Calculate the Test Statistic:
- Use the appropriate formula for your test (e.g., t-statistic, z-score).
- The test statistic measures how far the observed data is from the null hypothesis.
- Find the P-Value:
- Once the test statistic is calculated, use statistical tables (such as the z-table, t-table, or chi-square distribution table) to find the p-value associated with the statistic.
- Alternatively, use statistical software or a p-value calculator to obtain the p-value directly.
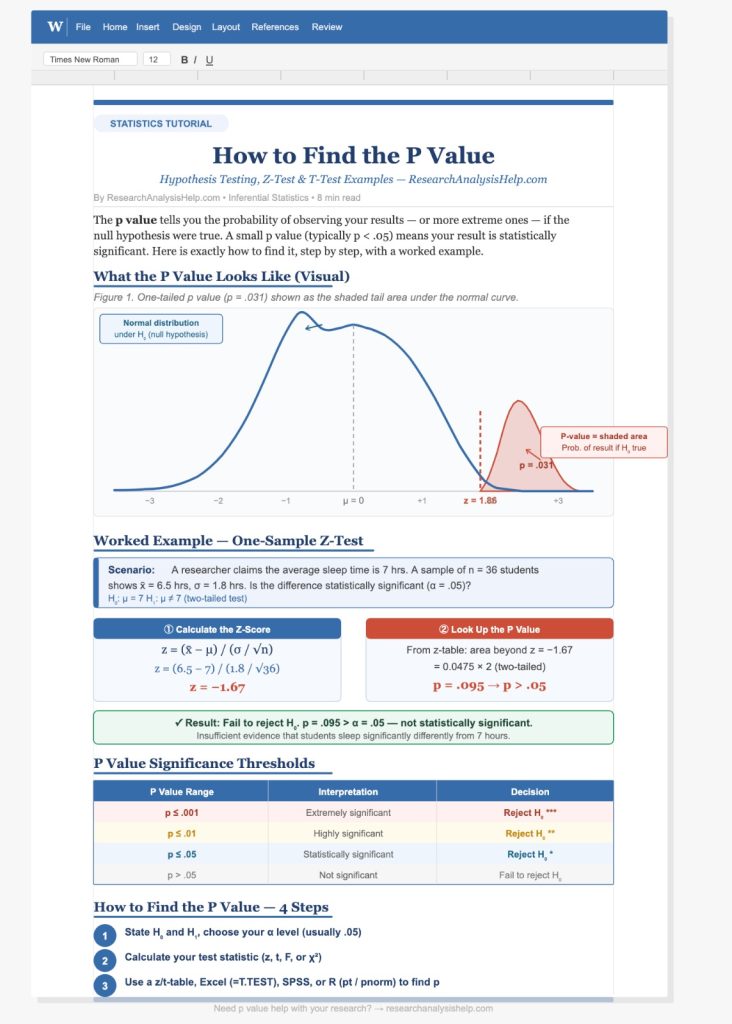
Example of Calculating the P-Value for a Z-Test
Let’s walk through an example of calculating the p-value for a z-test:
Problem:
- You are testing whether the average test score of a sample of 100 students differs significantly from a population mean of 75.
- The sample mean is 78, and the population standard deviation is 10.
Step-by-Step Calculation:
- State the Hypotheses:
- Null hypothesis (H₀): ( \mu = 75 )
- Alternative hypothesis (H₁): ( \mu \neq 75 ) (this is a two-tailed test)
- Calculate the Z-Score:
[
z = \frac{\overline{X} – \mu}{\frac{\sigma}{\sqrt{n}}}
]
Where:- ( \overline{X} = 78 )
- ( \mu = 75 )
- ( \sigma = 10 )
- ( n = 100 )
z = \frac{78 – 75}{\frac{10}{\sqrt{100}}} = \frac{3}{1} = 3.0
] - Find the P-Value:
- Using the z-table or a calculator, the p-value for a z-score of 3.0 is approximately 0.0027.
- Interpret the P-Value:
- Since the p-value (0.0027) is less than 0.05, we reject the null hypothesis and conclude that there is a statistically significant difference between the sample mean and the population mean.
How to Interpret P-Values
Interpreting P-Values in Hypothesis Testing
- P-Value Less Than 0.05:
- If the p-value is less than the significance level (α), typically 0.05, you reject the null hypothesis. This suggests strong evidence in favor of the alternative hypothesis.
- P-Value Greater Than 0.05:
- If the p-value is greater than the significance level, you fail to reject the null hypothesis. This suggests weak evidence against the null hypothesis, and any observed differences may be due to random chance.
- P-Value of 0.01:
- A p-value of 0.01 indicates that the probability of observing the data, assuming the null hypothesis is true, is 1%. This is considered strong evidence against the null hypothesis.
- P-Value of 0.001:
- A p-value of 0.001 means there is only a 0.1% chance of obtaining the observed result if the null hypothesis were true. This is very strong evidence to reject the null hypothesis.
Common Uses of P-Value
- Z-Test:
- A z-test is used to test if the sample mean differs significantly from the population mean, especially for large sample sizes or when the population standard deviation is known. The p-value helps determine if the result is statistically significant.
- T-Test:
- A t-test is used to compare the means of two samples or a sample and a population, particularly when the population standard deviation is unknown or the sample size is small. P-values are used to assess the significance of the difference between the means.
- Chi-Square Test:
- In chi-square tests, the p-value helps determine whether there is a significant association between two categorical variables.
- ANOVA:
- Analysis of variance (ANOVA) compares the means of more than two groups, and the p-value helps determine if the means of the groups differ significantly.
Need help with p-value calculations and hypothesis testing?
Whether you’re comparing means, performing t-tests, or analyzing chi-square tests, Research Analysis Help is here to guide you through every step of your statistical analysis.
Related Assignments to Master P-Value Calculations and Hypothesis Testing
These related assignments will deepen your understanding of p-values, test statistics, and the application of chi-square tests in statistical hypothesis testing. You will learn how to calculate p-values, interpret them, and apply them to determine the significance of various statistical tests.
1. Calculating P-Value for Chi-Square Tests
Assignment: Given a chi-square dataset, calculate the test statistic and p-value to determine if there is a significant association between two categorical variables. Use the chi-square distribution and degrees of freedom to find the critical value and compare it with the test statistic.
- Goal: Learn how to calculate the p-value for a chi-square test and interpret the results.
- Tools: Chi-square calculator, p-value calculator.
- Key Terms: Test statistic, p-value from test statistics, interpret p-values, degrees of freedom, significance level.
2. Interpreting P-Values from Test Statistics in Hypothesis Testing
Assignment: Given the test statistic from a t-test, z-test, or chi-square test, calculate the p-value and interpret its meaning. Based on the level of significance, decide whether to reject or fail to reject the null hypothesis. Consider both one-sided and two-sided p-values.
- Goal: Practice interpreting p-values and making statistical decisions based on different significance levels.
- Tools: P-value calculator, t-table, z-table, chi-square table.
- Key Terms: P-value used, level of significance, null hypothesis, two-sided p-value, report the p-value.
3. Using P-Value to Compare Two Sample Means
Assignment: Conduct a two-sample t-test to compare two sample means. Calculate the test statistic and p-value for both samples, and interpret whether the difference between the two means is statistically significant.
- Goal: Learn to use p-value to compare the means of two samples and assess the strength of the statistical evidence.
- Tools: T-distribution table, p-value calculator.
- Key Terms: P-value means, p-value approach, null hypothesis is correct, difference between two, test statistic.
4. Calculating and Interpreting P-Values from a Chi-Square Test
Assignment: Given the observed and expected frequencies, perform a chi-square test to test for independence between two categorical variables. Calculate the chi-square statistic, the corresponding p-value, and decide whether the null hypothesis should be rejected.
- Goal: Practice chi-square hypothesis testing, calculate the p-value, and interpret the results to reject or fail to reject the null hypothesis.
- Tools: Chi-square distribution table, critical value calculator.
- Key Terms: P-value from test statistics, p-value used, null hypothesis would be rejected, significance level.
5. Testing for Significant Differences with Small P-Values
Assignment: Perform a z-test or t-test and calculate the p-value. Given a small p-value (e.g., 0.001), determine if the result is statistically significant at a significance level of 0.05 or 0.01. Discuss the implications of a small p-value in terms of evidence against the null hypothesis.
- Goal: Understand how a small p-value provides strong evidence to reject the null hypothesis.
- Tools: Z-table, t-table, p-value calculator.
- Key Terms: Small p-value, null hypothesis should be rejected, evidence against the null hypothesis, significance level.
6. Using P-Value Approach in Hypothesis Testing for Two Variables
Assignment: Given a data set with two variables, perform a regression analysis to test the relationship between two variables. Calculate the p-value for the test statistic and determine if the relationship is statistically significant at a significance level of 0.05.
- Goal: Learn to interpret the p-value in the context of regression analysis and linear relationships between variables.
- Tools: Statistical software, p-value calculator.
- Key Terms: P-value used, probability value, relationship between two variables, statistical significance.
7. Report the P-Value in Statistical Tests and Make Inferences
Assignment: After performing a t-test or ANOVA, calculate the p-value and test statistic. Report the p-value and explain its meaning in relation to the null hypothesis. Discuss whether you support or reject the null hypothesis based on the p-value.
- Goal: Practice reporting the p-value in a statistical test and making inferences about the null hypothesis.
- Tools: P-value calculator, t-distribution table, ANOVA calculator.
- Key Terms: P-value means, null hypothesis states, two-sided p-value, report the p-value.
8. Hypothesis Testing for the Difference Between Two Means Using P-Values
Assignment: Conduct a t-test to compare the means of two independent samples. Calculate the test statistic, p-value, and interpret whether the means differ statistically. Use the p-value approach to determine if the difference is statistically significant.
- Goal: Compare two means and interpret the p-value to determine if the observed difference is due to random chance.
- Tools: T-distribution table, p-value calculator.
- Key Terms: P-value used, two means, compare two, statistical significance.
9. Interpreting Small P-Values and Reporting Statistical Results
Assignment: For a given test statistic, calculate the p-value and assess its significance. If the p-value is less than 0.05, discuss the implications of rejecting the null hypothesis. Explain how a small p-value provides strong evidence to support the alternative hypothesis.
- Goal: Understand how to interpret small p-values and report statistical results in terms of hypothesis testing.
- Tools: P-value calculator, statistical software.
- Key Terms: Small p-value, p-value means, null hypothesis would be rejected, significance level.
10. Comparing Two Sample Means with P-Values in Hypothesis Testing
Assignment: Given two independent samples, calculate the p-value for a two-sample t-test. Use the test statistic to determine if the means of the two samples differ significantly. Interpret the p-value and decide whether to reject or fail to reject the null hypothesis.
- Goal: Learn to compare two sample means using the p-value and understand its role in hypothesis testing.
- Tools: T-distribution table, p-value calculator.
- Key Terms: Test statistic, two-tailed p-value, null hypothesis.
These related assignments provide a deep dive into calculating, interpreting, and applying p-values in hypothesis testing. Whether you’re performing chi-square tests, t-tests, or regression analysis, understanding p-values is essential for making informed decisions and drawing valid conclusions from your data.
For expert assistance with p-value calculations, hypothesis testing, or statistical analysis, Research Analysis Help is here to guide you through every step!
📧 Contact us today at Research Analysis Help for personalized support with your statistical analysis! 📊
Conclusion
The p-value is a crucial component in hypothesis testing, helping you determine whether the observed results are due to random chance or whether they provide statistical evidence to support the alternative hypothesis. Calculating p-values allows you to make informed decisions about whether to reject or fail to reject the null hypothesis, guiding you through the process of statistical significance.
At Research Analysis Help, we offer expert support in calculating and interpreting p-values across various statistical tests, including z-tests, t-tests, and ANOVA. If you’re struggling with statistical hypothesis testing or need help calculating p-values, reach out to us today!
📧 Contact us now at Research Analysis Help for personalized assistance with your statistical analysis and hypothesis testing! 📊
Final Thoughts
The p-value is a crucial tool in hypothesis testing, helping you assess whether the results of your experiment or study provide enough evidence to reject the null hypothesis. By calculating the p-value, you can determine the statistical significance of your results and make informed decisions about your research.
At Research Analysis Help, we provide expert assistance in calculating and interpreting p-values across various statistical tests, such as z-tests, t-tests, and ANOVA. If you need help with hypothesis testing or p-value calculations, our team is here to support you.
📧 Contact us today at Research Analysis Help for personalized support with your statistical analysis! 📊
FAQs:
How Do You Calculate the P-Value?
The p-value is a key statistic used in hypothesis testing to determine the likelihood of observing data at least as extreme as the observed data, assuming the null hypothesis is true. Here’s how you can calculate the p-value:
- State the Hypotheses:
- Null hypothesis (H₀): Assumes no effect or no difference (e.g., the mean of the sample equals the population mean).
- Alternative hypothesis (H₁): Assumes a significant effect or difference.
- Choose the Significance Level (α):
- Common significance levels are 0.05 (5%), 0.01 (1%), or 0.10 (10%).
- Calculate the Test Statistic:
- For a z-test, use the formula:
[
z = \frac{\overline{X} – \mu}{\frac{\sigma}{\sqrt{n}}}
]
Where:- ( \overline{X} ) = sample mean
- ( \mu ) = population mean
- ( \sigma ) = population standard deviation
- ( n ) = sample size
- For a z-test, use the formula:
- Find the P-Value:
- Using the test statistic, look up the p-value in a z-distribution or t-distribution table (based on the test type). For a two-sided test, find the probability value that the test statistic is at least as extreme as the observed value.
- Interpret the P-Value:
- If the p-value is less than α, reject the null hypothesis. This indicates strong evidence against the null hypothesis.
- If the p-value is greater than α, fail to reject the null hypothesis. This indicates weak evidence against the null hypothesis.
How Do I Find the Value of P?
To find the value of p, follow the steps for calculating the p-value based on the test you are performing:
- Obtain the Test Statistic: You need the test statistic (such as a z-score, t-statistic, or chi-square statistic) from your sample data.
- Determine the Degrees of Freedom (for t-tests and chi-square tests):
- For a t-test, degrees of freedom are calculated as ( n – 1 ), where ( n ) is the sample size.
- For a chi-square test, degrees of freedom are calculated as ( (r – 1)(c – 1) ), where ( r ) and ( c ) are the number of rows and columns in a contingency table.
- Use a P-Value Calculator or Table: Look up your test statistic in a z-table, t-table, or chi-square distribution table, depending on the test you are using, to obtain the p-value.
- Interpret the P-Value: Compare the p-value to the significance level (α) to decide whether to reject or fail to reject the null hypothesis.
Can I Calculate P-Value by Hand?
Yes, it is possible to calculate the p-value by hand, although it can be tedious and requires some statistical knowledge. Here’s a simplified outline:
- Calculate the Test Statistic: For example, if you are performing a z-test or t-test, you would use the respective formula to calculate the test statistic (like z-score or t-statistic) from the sample data.
- Find the Critical Value: Look up the critical value corresponding to your test statistic in the appropriate distribution table (z, t, or chi-square). The critical value is determined by the confidence level or significance level (α).
- Determine the P-Value:
- For z-tests, use the z-table to find the probability corresponding to the z-score.
- For t-tests, use the t-distribution table to find the probability for the t-statistic.
- The p-value is the probability of obtaining a test statistic at least as extreme as the observed value under the null hypothesis.
- Interpret the P-Value: Compare the calculated p-value to the significance level (α) to decide whether to reject or fail to reject the null hypothesis.
While it is possible to calculate p-values by hand, using a calculator or statistical software can make this process much faster and more accurate.
What is P-Value 0.05 in Statistics?
In statistics, a p-value of 0.05 is commonly used as a threshold to determine statistical significance. Here’s how it works:
- A p-value of 0.05 means there is a 5% probability that the observed data (or more extreme data) occurred due to random chance, assuming the null hypothesis is true.
- If the p-value is less than 0.05, you typically reject the null hypothesis, as it suggests the result is unlikely to have occurred by random chance and that there is statistical evidence for the alternative hypothesis.
- If the p-value is greater than 0.05, you fail to reject the null hypothesis, indicating insufficient evidence to support the alternative hypothesis.
In a two-tailed test, a p-value of 0.05 would split the 5% significance level into two tails of the distribution, with 2.5% in each tail. In a one-tailed test, the entire 5% would be in one tail.
Key Points to Remember
- P-Value Definition: The p-value is the probability of obtaining a test statistic as extreme as, or more extreme than, the observed data, assuming the null hypothesis is true.
- Interpreting P-Values:
- P-value < 0.05: Reject the null hypothesis. This means the result is statistically significant.
- P-value > 0.05: Fail to reject the null hypothesis. This means the result is not statistically significant.
- Types of Tests: The p-value is used in many hypothesis tests, including t-tests, z-tests, chi-square tests, and ANOVA. The p-value helps determine whether the observed difference between sample means or data points is statistically significant.
- Two-Tailed vs. One-Tailed: A two-tailed test looks for deviations in both directions (positive and negative), while a one-tailed test looks for deviations in one direction only.
- Using a P-Value Calculator: You can use statistical software or an online p-value calculator to quickly find the p-value for any given test statistic.